Note
Go to the end to download the full example code.
Whole-habitat radiomics
Background. Per-habitat radiomics describes the MRI inside each habitat. Whole-habitat radiomics instead describes the habitat map itself: the label image (habitat ids as grey values) is fed to PyRadiomics as the image, and the whole labelled region as the mask.
Purpose. You get one row of features describing the partition (here
first-order Mean / Entropy of the labels and shape features such
as Sphericity and SurfaceArea), a habitat overlay, and a map of local
label entropy.
Key terms.
shape feature – geometry of the labelled region (e.g. how close it is to a sphere, its surface area), independent of intensity.
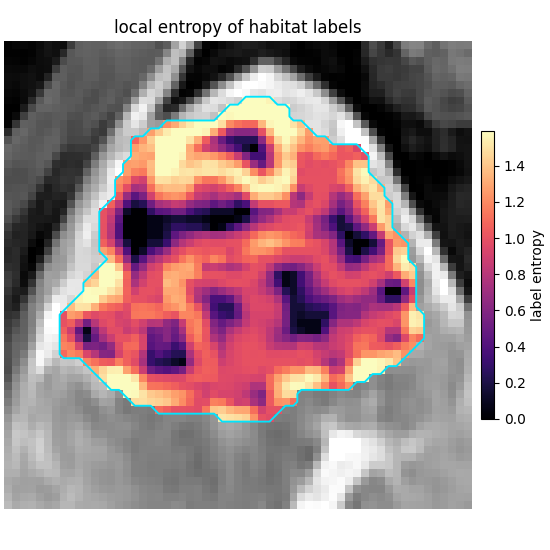
label entropy – how mixed the ids are in a small window around each voxel; zero inside one uniform habitat, higher where habitats (or the background at the tumour edge) meet.
habitat / one-step habitats – see Volume and fractions and Defining habitats inside each subject.
Quantify the shape and spatial distribution of the partition map itself
using WholeHabitatRadiomicsFeatures.
The habitat label image plays both intensity and mask roles.
One-step habitats, then whole-map PyRadiomics on the label field. sphinx_gallery_thumbnail_number = 2
from pathlib import Path
from typing import Any, Dict

import matplotlib.pyplot as plt
import numpy as np

from habit.contracts import MaskVolume, cohort_from_directory
from habit.datasets import fetch_demo
from habit.habitat_features import WholeHabitatRadiomicsFeatures
from habit.kernels import local_entropy_map
from habit.recipes import one_step_habitat
from habit.viz import plot_habitat_overlay, plot_voxel_texture_slice

DATA = fetch_demo()
MODALITIES = ("LAP",)
ROI = "LAP"
cohort = cohort_from_directory(DATA, modalities=MODALITIES, roi=ROI)[:1]
result = one_step_habitat(
    modalities=MODALITIES, n_habitats=3, random_seed=0, roi=ROI
).fit_predict(cohort)
subject = cohort[0]
habitat_map = result.habitat_maps[0]

params: Dict[str, Any] = {
    "imageType": {"Original": {}},
    "featureClass": {
        "firstorder": ["Mean", "Entropy"],
        "shape": ["Sphericity", "SurfaceArea"],
    },
    # binWidth=1 keeps each integer habitat id in its own grey-level bin.
    "setting": {"binWidth": 1, "voxelArrayShift": 0},
}
table = WholeHabitatRadiomicsFeatures(params=params)(subject, habitat_map)
row = table.frame.iloc[0]
print("Whole-habitat radiomics:")
print(row.to_string())
row
HABIT demo data (cached)
DATA (preprocessed root): C:\Users\dongm\.habit_data\demo-data-v1\preprocessed

On-disk inventory of this folder:
  subjects (5): subj001, subj002, subj003, subj004, subj005
  image series: LAP, PVP, delay_3min, pre_contrast
  mask keys:    LAP, PVP, delay_3min, pre_contrast
  example image: images/subj001/delay_3min/WATER__BH_Ax_LAVA_Flex_3min_Series0012.nrrd
  example mask:  masks/subj001/delay_3min/WATER__BH_Ax_LAVA_Flex_10min_Series0017_mask.nrrd

Your own data must use the same folder tree (change IDs / series names):

  DATA/
    images/<subject_id>/<modality>/<one image file>
    masks/<subject_id>/<roi>/<one mask file>

Then load it with the same call the demos use:

  cohort = cohort_from_directory(DATA, modalities=("LAP",), roi="LAP")

Swap DATA / modalities / roi to match your tree. Mask key is often the
same as one image series (here LAP).

Cohort.map[_DefineAndLabelWithinSubject]:   0%|          | 0/1 [00:00<?, ?it/s]
Cohort.map[_DefineAndLabelWithinSubject]: 100%|██████████| 1/1 [00:01<00:00,  1.29s/it]
Cohort.map[_DefineAndLabelWithinSubject]: 100%|██████████| 1/1 [00:01<00:00,  1.29s/it]
Whole-habitat radiomics:
subject                            subj001
original_shape_Sphericity         0.719657
original_shape_SurfaceArea     7141.076123
original_firstorder_Mean          1.889318
original_firstorder_Entropy       1.565974

subject                            subj001
original_shape_Sphericity         0.719657
original_shape_SurfaceArea     7141.076123
original_firstorder_Mean          1.889318
original_firstorder_Entropy       1.565974
Name: 0, dtype: object
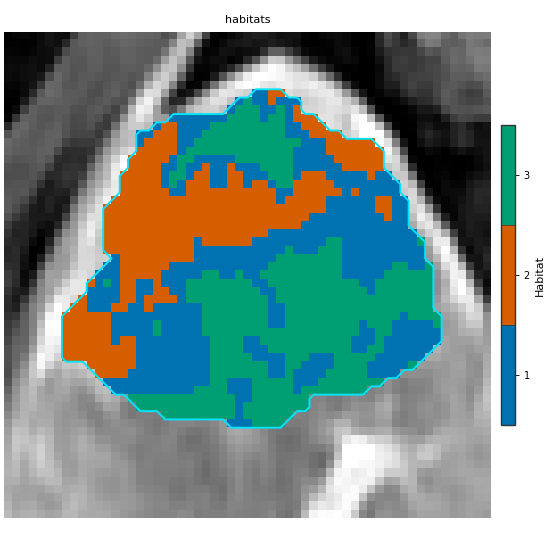
Same objects as the table: habitat IDs are the intensity image. First figure: the partition. Second: local entropy of those discrete labels (not of the MRI), cropped to the same ROI.
Path("out").mkdir(exist_ok=True)
image_vol = subject.image(ROI)
fig_hab = plot_habitat_overlay(
    image_vol,
    habitat_map,
    axis=0,
    crop_to="labels",
    title="habitats",
)
fig_hab.savefig("out/whole_habitat_radiomics_overlay.png", dpi=150, bbox_inches="tight")
plt.show()

label_intensity: np.ndarray = np.asarray(habitat_map.label_array, dtype=np.float64)
n_label_bins: int = max(int(label_intensity.max()) + 1, 2)
# 5x5x5 window; one histogram bin per id (background 0 included).
entropy = local_entropy_map(label_intensity, kernel_size=5, bins=n_label_bins)
habitat_roi = MaskVolume.from_geometry(
    (habitat_map.label_array > 0).astype(np.uint8),
    habitat_map.geometry,
    roi_name=ROI,
)
fig = plot_voxel_texture_slice(
    entropy,
    anatomy=image_vol,
    roi_mask=habitat_roi,
    axis=0,
    crop_to="roi",
    title="local entropy of habitat labels",
    feature_label="label entropy",
)
fig.savefig("out/whole_habitat_radiomics_texture.png", dpi=150, bbox_inches="tight")
plt.show()
F:\work\habit_project\habit\viz\habitat_overlay.py:806: UserWarning: Display geometry conflict: image/anatomy direction does not match mask/label direction. Using the mask/label direction so coronal/sagittal superior-up follows the labelled anatomy. Pass direction= to override.
  resolved_direction, resolved_spacing = resolve_display_geometry(
F:\work\habit_project\habit\viz\voxel_texture.py:1019: UserWarning: Display geometry conflict: image/anatomy direction does not match mask/label direction. Using the mask/label direction so coronal/sagittal superior-up follows the labelled anatomy. Pass direction= to override.
  direction, spacing = resolve_display_geometry(
Total running time of the script: (0 minutes 22.960 seconds)