Note
Go to the end to download the full example code.
Volume and fractions
Background. The simplest habitat number is how much of the tumour each habitat occupies. Volume fractions let you ask, for example, whether a larger share of one habitat goes with a worse outcome.
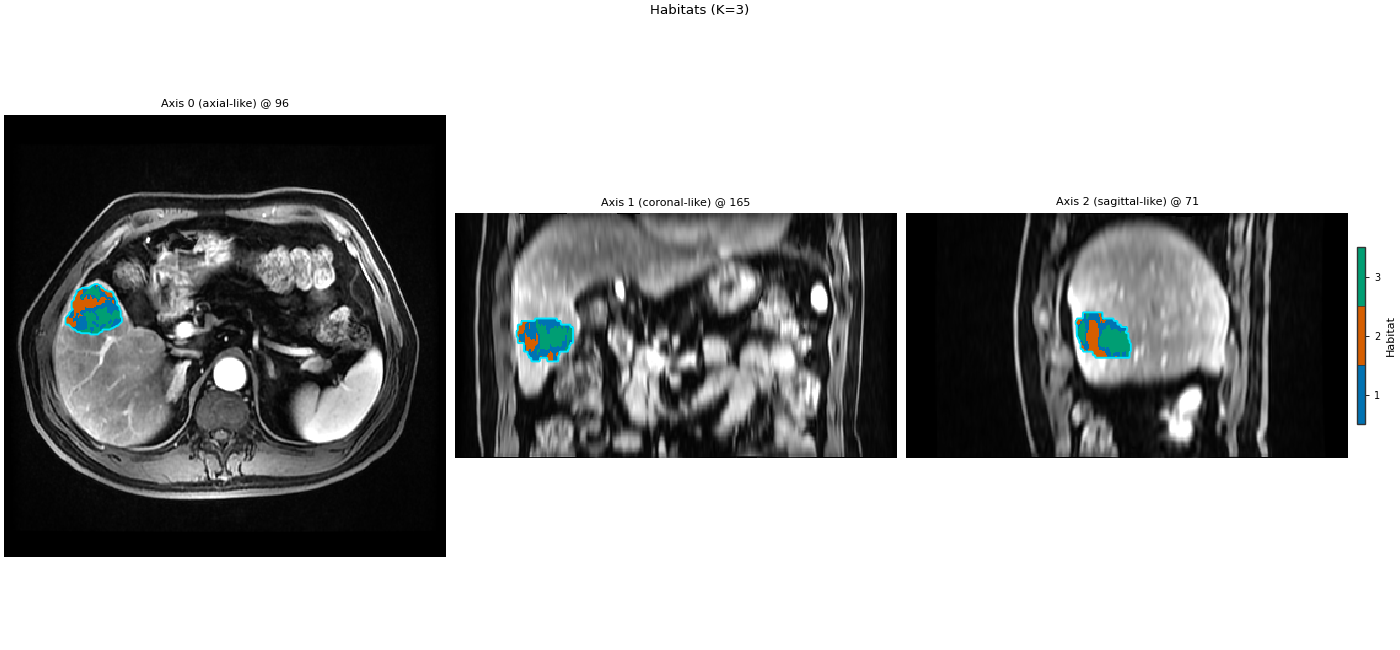
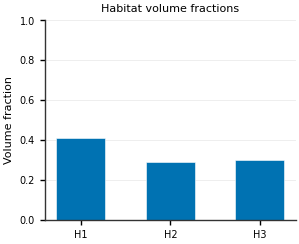
Purpose. You get a table with one row per habitat (volume fraction, number of separate pieces, size of the largest piece), an overlay of the habitat map, and a bar chart of the fractions.
Key terms.
habitat – a sub-region inside the tumour (the ROI) whose voxels behave alike across the input images; HABIT paints each ROI voxel with a habitat id (1, 2, 3, …).
volume fraction – voxels of one habitat divided by all non-background voxels of the map; fractions sum to 1.
region – one face-connected piece of a habitat;
num_regionscounts the pieces andlargest_region_voxelsis the size of the biggest one.one-step habitats – clustered inside this one subject; see Defining habitats inside each subject.
Atomic volume metrics from a habitat label map:
habitat_volume_fractions() and
habitat_region_stats().
One-step habitats give a map to quantify. sphinx_gallery_thumbnail_number = 2
from pathlib import Path

import matplotlib.pyplot as plt
import pandas as pd

from habit.contracts import cohort_from_directory
from habit.datasets import fetch_demo
from habit.kernels import habitat_region_stats, habitat_volume_fractions
from habit.recipes import one_step_habitat
from habit.viz import plot_habitat_overlay, plot_habitat_volume_fractions

DATA = fetch_demo()
MODALITIES = ("LAP",)
ROI = "LAP"
cohort = cohort_from_directory(DATA, modalities=MODALITIES, roi=ROI)[:1]
result = one_step_habitat(
    modalities=MODALITIES, n_habitats=3, random_seed=0, roi=ROI
).fit_predict(cohort)
habitat_map = result.habitat_maps[0]
labels = habitat_map.label_array
HABIT demo data (cached)
DATA (preprocessed root): C:\Users\dongm\.habit_data\demo-data-v1\preprocessed

On-disk inventory of this folder:
  subjects (5): subj001, subj002, subj003, subj004, subj005
  image series: LAP, PVP, delay_3min, pre_contrast
  mask keys:    LAP, PVP, delay_3min, pre_contrast
  example image: images/subj001/delay_3min/WATER__BH_Ax_LAVA_Flex_3min_Series0012.nrrd
  example mask:  masks/subj001/delay_3min/WATER__BH_Ax_LAVA_Flex_10min_Series0017_mask.nrrd

Your own data must use the same folder tree (change IDs / series names):

  DATA/
    images/<subject_id>/<modality>/<one image file>
    masks/<subject_id>/<roi>/<one mask file>

Then load it with the same call the demos use:

  cohort = cohort_from_directory(DATA, modalities=("LAP",), roi="LAP")

Swap DATA / modalities / roi to match your tree. Mask key is often the
same as one image series (here LAP).

Cohort.map[_DefineAndLabelWithinSubject]:   0%|          | 0/1 [00:00<?, ?it/s]
Cohort.map[_DefineAndLabelWithinSubject]: 100%|██████████| 1/1 [00:01<00:00,  1.35s/it]
Cohort.map[_DefineAndLabelWithinSubject]: 100%|██████████| 1/1 [00:01<00:00,  1.35s/it]
Volume fractions and connected-component stats per habitat id. Collect the non-background ids actually present in this map.
ids = tuple(sorted({int(v) for v in labels.ravel() if int(v) != 0}))
# Share of the ROI per habitat: {habitat id: fraction in [0, 1]}.
frac = habitat_volume_fractions(labels, ids)
# Fragmentation per habitat: {habitat id: (num_regions, largest_region_voxels)}.
stats = habitat_region_stats(labels)
table = pd.DataFrame(
    [
        {
            "habitat": f"H{hid}",
            "volume_fraction": float(frac[hid]),
            "num_regions": int(stats[hid][0]),
            "largest_region_voxels": int(stats[hid][1]),
        }
        for hid in ids
    ]
)
print(table.to_string(index=False))
table

Path("out").mkdir(exist_ok=True)
fig = plot_habitat_overlay(
    cohort[0].image(ROI),
    habitat_map,
    title="Habitats (K=3)",
)
fig.savefig("out/volume_fractions_overlay.png", dpi=150, bbox_inches="tight")
fig_frac = plot_habitat_volume_fractions(frac)
fig_frac.savefig("out/volume_fractions_bar.png", dpi=150, bbox_inches="tight")
plt.show()
habitat  volume_fraction  num_regions  largest_region_voxels
     H1         0.410791           29                  14183
     H2         0.289099           20                   9499
     H3         0.300110           19                   9063
F:\work\habit_project\habit\viz\habitat_overlay.py:806: UserWarning: Display geometry conflict: image/anatomy direction does not match mask/label direction. Using the mask/label direction so coronal/sagittal superior-up follows the labelled anatomy. Pass direction= to override.
  resolved_direction, resolved_spacing = resolve_display_geometry(
Total running time of the script: (0 minutes 6.660 seconds)