Note
Go to the end to download the full example code.
Per-habitat radiomics
Background. Classic radiomics computes intensity and texture features over the whole tumour. Per-habitat radiomics computes the same PyRadiomics features separately inside each habitat, so every sub-region gets its own intensity and texture description.
Purpose. You get one row per subject with columns
habitat_{id}_{feature}_of_{modality} (plus has_habitat_{id}), maps
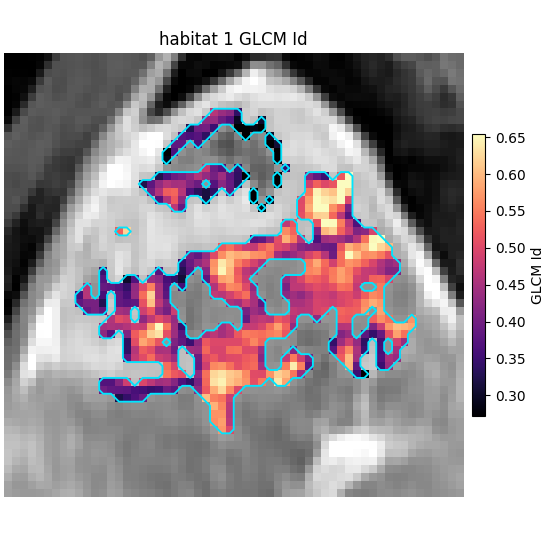
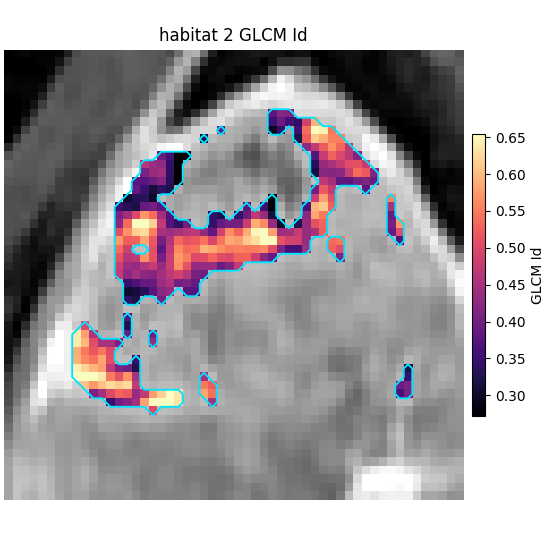
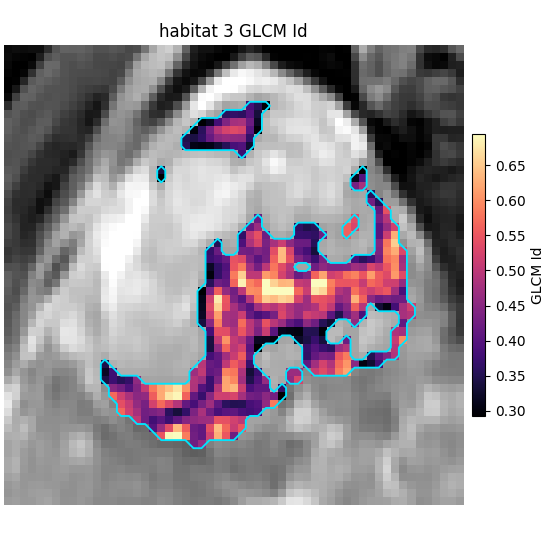
of voxel-wise GLCM Id inside each habitat, and a bar chart comparing the
habitats feature by feature.
Key terms.
first-order feature – a statistic of the voxel intensities alone (e.g.
Mean,Energy), ignoring their spatial arrangement.GLCM feature – texture from the grey-level co-occurrence matrix, i.e. how often pairs of neighbouring voxels share grey levels (e.g.
Id).binWidth – width of the intensity bins used before texture features; bins are set per habitat, as in PyRadiomics
execute(label=id).one-step habitats – see Defining habitats inside each subject; match ids before comparing
habitat_1_*across patients (Matching habitat labels across subjects).
Extract first-order and GLCM features within each habitat subregion
using EachHabitatRadiomicsFeatures.
One-step habitats, then per-habitat PyRadiomics on the intensity image. sphinx_gallery_thumbnail_number = 1
from pathlib import Path
from typing import Any, Dict, List, Optional, Tuple

import matplotlib.pyplot as plt
import numpy as np
import pandas as pd

from habit.contracts import MaskVolume, cohort_from_directory
from habit.datasets import fetch_demo
from habit.habitat_features import EachHabitatRadiomicsFeatures
from habit.recipes import one_step_habitat
from habit.voxel_features import extract_voxel_texture
from habit.viz import plot_voxel_texture_slice

DATA = fetch_demo()
MODALITIES = ("LAP",)
ROI = "LAP"
cohort = cohort_from_directory(DATA, modalities=MODALITIES, roi=ROI)[:1]
result = one_step_habitat(
    modalities=MODALITIES, n_habitats=3, random_seed=0, roi=ROI
).fit_predict(cohort)
subject = cohort[0]
habitat_map = result.habitat_maps[0]

# Narrow PyRadiomics params keep the gallery table readable.
params: Dict[str, Any] = {
    "imageType": {"Original": {}},
    "featureClass": {
        "firstorder": ["Mean", "Energy"],
        "glcm": ["Autocorrelation", "Id"],
    },
    "setting": {"binWidth": 25, "voxelArrayShift": 0},
}
# One PyRadiomics pass per habitat id, using the habitat map as the mask.
table = EachHabitatRadiomicsFeatures(params=params)(subject, habitat_map)
row = table.frame.iloc[0]
display_cols = [
    col
    for col in table.feature_columns
    if "firstorder" in col or "glcm" in col
][:8]
print("Per-habitat radiomics (sample columns):")
print(row[display_cols].to_string())
row[display_cols]
HABIT demo data (cached)
DATA (preprocessed root): C:\Users\dongm\.habit_data\demo-data-v1\preprocessed

On-disk inventory of this folder:
  subjects (5): subj001, subj002, subj003, subj004, subj005
  image series: LAP, PVP, delay_3min, pre_contrast
  mask keys:    LAP, PVP, delay_3min, pre_contrast
  example image: images/subj001/delay_3min/WATER__BH_Ax_LAVA_Flex_3min_Series0012.nrrd
  example mask:  masks/subj001/delay_3min/WATER__BH_Ax_LAVA_Flex_10min_Series0017_mask.nrrd

Your own data must use the same folder tree (change IDs / series names):

  DATA/
    images/<subject_id>/<modality>/<one image file>
    masks/<subject_id>/<roi>/<one mask file>

Then load it with the same call the demos use:

  cohort = cohort_from_directory(DATA, modalities=("LAP",), roi="LAP")

Swap DATA / modalities / roi to match your tree. Mask key is often the
same as one image series (here LAP).

Cohort.map[_DefineAndLabelWithinSubject]:   0%|          | 0/1 [00:00<?, ?it/s]
Cohort.map[_DefineAndLabelWithinSubject]: 100%|██████████| 1/1 [00:01<00:00,  1.21s/it]
Cohort.map[_DefineAndLabelWithinSubject]: 100%|██████████| 1/1 [00:01<00:00,  1.21s/it]
Per-habitat radiomics (sample columns):
habitat_1_original_firstorder_Mean_of_LAP            864.629175
habitat_1_original_firstorder_Energy_of_LAP       10697090209.0
habitat_1_original_glcm_Autocorrelation_of_LAP        28.315112
habitat_1_original_glcm_Id_of_LAP                      0.524501
habitat_2_original_firstorder_Mean_of_LAP           1052.128514
habitat_2_original_firstorder_Energy_of_LAP       11154654867.0
habitat_2_original_glcm_Autocorrelation_of_LAP        30.198113
habitat_2_original_glcm_Id_of_LAP                      0.514066

habitat_1_original_firstorder_Mean_of_LAP            864.629175
habitat_1_original_firstorder_Energy_of_LAP       10697090209.0
habitat_1_original_glcm_Autocorrelation_of_LAP        28.315112
habitat_1_original_glcm_Id_of_LAP                      0.524501
habitat_2_original_firstorder_Mean_of_LAP           1052.128514
habitat_2_original_firstorder_Energy_of_LAP       11154654867.0
habitat_2_original_glcm_Autocorrelation_of_LAP        30.198113
habitat_2_original_glcm_Id_of_LAP                      0.514066
Name: 0, dtype: object
Voxel-wise GLCM Id inside each habitat. Same feature name and
binWidth=25 as the table; the table is one ROI-level scalar per
habitat, these maps use a 3x3x3 kernel around each voxel.
Path("out").mkdir(exist_ok=True)
image_vol = subject.image(ROI)
glcm_field = extract_voxel_texture(
    image_vol,
    subject.mask(ROI),
    kernel_radius=1,
    bin_width=25,
    feature_classes={"glcm": ["Id"]},
)
glcm_id_feature = next(
    name for name in glcm_field.feature_names if "glcm_Id" in name
)
habitat_ids: List[int] = [
    hid
    for hid in habitat_map.habitat_ids
    if bool(np.any(habitat_map.label_array == hid))
]
for hid in habitat_ids:
    habitat_roi = MaskVolume.from_geometry(
        (habitat_map.label_array == hid).astype(np.uint8),
        habitat_map.geometry,
        roi_name=ROI,
        labels=(int(hid),),
    )
    fig_tex = plot_voxel_texture_slice(
        glcm_field,
        feature=glcm_id_feature,
        anatomy=image_vol,
        roi_mask=habitat_roi,
        axis=0,
        crop_to="roi",
        title=f"habitat {hid} GLCM Id",
        feature_label="GLCM Id",
    )
    fig_tex.savefig(
        f"out/each_habitat_{hid}_glcm_id.png",
        dpi=150,
        bbox_inches="tight",
    )
    plt.show()
voxel_radiomics: glcm batch 1/35 0.208s peak=38MiB
voxel_radiomics: glcm batch 2/35 0.015s peak=39MiB
voxel_radiomics: glcm batch 3/35 0.019s peak=40MiB
voxel_radiomics: glcm batch 4/35 0.020s peak=40MiB
voxel_radiomics: glcm batch 5/35 0.016s peak=41MiB
voxel_radiomics: glcm batch 6/35 0.017s peak=42MiB
voxel_radiomics: glcm batch 7/35 0.017s peak=43MiB
voxel_radiomics: glcm batch 8/35 0.019s peak=44MiB
voxel_radiomics: glcm batch 9/35 0.018s peak=45MiB
voxel_radiomics: glcm batch 10/35 0.017s peak=46MiB
voxel_radiomics: glcm batch 11/35 0.019s peak=47MiB
voxel_radiomics: glcm batch 12/35 0.018s peak=48MiB
voxel_radiomics: glcm batch 13/35 0.016s peak=49MiB
voxel_radiomics: glcm batch 14/35 0.016s peak=49MiB
voxel_radiomics: glcm batch 15/35 0.015s peak=50MiB
voxel_radiomics: glcm batch 16/35 0.016s peak=51MiB
voxel_radiomics: glcm batch 17/35 0.015s peak=52MiB
voxel_radiomics: glcm batch 18/35 0.017s peak=53MiB
voxel_radiomics: glcm batch 19/35 0.015s peak=54MiB
voxel_radiomics: glcm batch 20/35 0.015s peak=55MiB
voxel_radiomics: glcm batch 21/35 0.015s peak=56MiB
voxel_radiomics: glcm batch 22/35 0.015s peak=57MiB
voxel_radiomics: glcm batch 23/35 0.017s peak=58MiB
voxel_radiomics: glcm batch 24/35 0.015s peak=1MiB
voxel_radiomics: glcm batch 25/35 0.015s peak=2MiB
voxel_radiomics: glcm batch 26/35 0.016s peak=3MiB
voxel_radiomics: glcm batch 27/35 0.014s peak=4MiB
voxel_radiomics: glcm batch 28/35 0.015s peak=4MiB
voxel_radiomics: glcm batch 29/35 0.014s peak=5MiB
voxel_radiomics: glcm batch 30/35 0.015s peak=6MiB
voxel_radiomics: glcm batch 31/35 0.015s peak=7MiB
voxel_radiomics: glcm batch 32/35 0.015s peak=8MiB
voxel_radiomics: glcm batch 33/35 0.015s peak=9MiB
voxel_radiomics: glcm batch 34/35 0.014s peak=10MiB
voxel_radiomics: glcm batch 35/35 0.015s peak=11MiB
F:\work\habit_project\habit\viz\voxel_texture.py:1019: UserWarning: Display geometry conflict: image/anatomy direction does not match mask/label direction. Using the mask/label direction so coronal/sagittal superior-up follows the labelled anatomy. Pass direction= to override.
  direction, spacing = resolve_display_geometry(
One panel per feature so scales stay honest (Mean / Energy / GLCM Id must not share a single y-axis — Energy dominates and hides the rest).
feature_specs: List[Tuple[str, str]] = [
    ("Mean", "firstorder_Mean"),
    ("Energy", "firstorder_Energy"),
    ("GLCM Id", "glcm_Id"),
]


def _column_for(habitat_id: int, suffix: str) -> Optional[str]:
    """Return the first feature column matching habitat id + suffix."""
    prefix = f"habitat_{habitat_id}_"
    for col in table.feature_columns:
        if col.startswith(prefix) and suffix in col:
            return col
    return None


panel_rows: List[Dict[str, Any]] = []
for hid in habitat_ids:
    for label, suffix in feature_specs:
        col = _column_for(hid, suffix)
        panel_rows.append(
            {
                "habitat": f"H{hid}",
                "feature": label,
                "value": float(row[col]) if col is not None else float("nan"),
            }
        )
panel = pd.DataFrame(panel_rows)
print(panel.to_string(index=False))
panel

fig, axes = plt.subplots(1, len(feature_specs), figsize=(9.5, 3.2), sharey=False)
if len(feature_specs) == 1:
    axes = [axes]
x = np.arange(len(habitat_ids))
xticklabels = [f"H{hid}" for hid in habitat_ids]
for ax, (label, suffix) in zip(axes, feature_specs):
    values: List[float] = []
    for hid in habitat_ids:
        col = _column_for(hid, suffix)
        values.append(float(row[col]) if col is not None else float("nan"))
    ax.bar(x, values, color="#0072B2", width=0.65)
    ax.set_xticks(x)
    ax.set_xticklabels(xticklabels)
    ax.set_ylabel(label)
    ax.set_title(label)
fig.suptitle("Per-habitat radiomics (one scale per feature)", y=1.02)
fig.tight_layout()
fig.savefig("out/each_habitat_radiomics_bar.png", dpi=150, bbox_inches="tight")
plt.show()
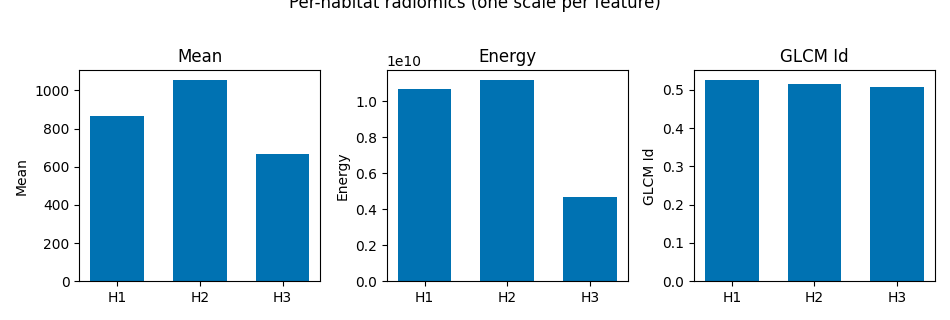
habitat feature        value
     H1    Mean 8.646292e+02
     H1  Energy 1.069709e+10
     H1 GLCM Id 5.245007e-01
     H2    Mean 1.052129e+03
     H2  Energy 1.115465e+10
     H2 GLCM Id 5.140657e-01
     H3    Mean 6.677535e+02
     H3  Energy 4.696840e+09
     H3 GLCM Id 5.060708e-01
Total running time of the script: (0 minutes 7.053 seconds)