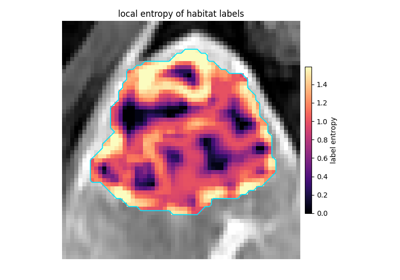
local_entropy_map
Note
This page is a reference documentation. It only explains the function signature, and not how to use it. Please refer to the Habitat Guide and Python API guide (v2.0) for usage.
- local_entropy_map(image: ndarray, *, kernel_size: int = 3, bins: int = 32) ndarray[source]
Shannon entropy of the intensity histogram in each voxel’s neighbourhood.
Intensities are min-max normalised over the whole array and discretised into
binslevels; for each level, a box convolution counts its occurrences in every neighbourhood, and the per-level probabilities are accumulated into-sum(p * log2 p).Neighbourhood counts are normalised by the full box volume rather than by the number of in-image voxels, matching v0.1: near the array border the box extends into implicit zeros, so border entropies are damped. This is kept deliberately, because the ROI normally sits well inside the image.
- Parameters:
image – Intensity array; 3-D in habitat analysis, but any dimensionality with a matching cubic box is accepted.
kernel_size – Neighbourhood edge length in voxels. Even values are incremented so the neighbourhood stays centred.
bins – Number of intensity bins.
- Returns:
A float64 entropy map with the same shape as
image, in bits.- Raises:
ValueError – If
kernel_sizeis not positive orbinsis below 2.