Note
Go to the end to download the full example code.
What matching changes in a cohort feature table
Background. Habitat features are usually analysed as a table with one row per patient and one column per habitat. That only works if a column refers to the same kind of habitat in every patient.
Purpose. You build one cohort table from five demo subjects with raw
and with prototype-matched ids, compare the spread of one column, and see
how max_distance can leave poorly matching habitats out of the shared
columns.
Key terms.
prototype – see Prototype matching step by step.
volume fraction – the share of ROI voxels that belong to one habitat.
max_distance – an optional cutoff: a habitat farther than this from every free prototype keeps a subject-local id instead of a shared one.
A cohort habitat table has one column per habitat id: H1_volume,
H2_mean_enhancement, … A column is only one variable if H2
means the same habitat in every row. With per-subject (one_step)
fits it does not, until the ids are matched.
This page builds the same table twice – raw per-subject ids, then
prototype-matched ids – and shows the spread of one column across
subjects. It ends with max_distance: how a habitat that resembles no
prototype can be left out of the shared columns instead of being forced
into one.
Per-subject habitats for five subjects
sphinx_gallery_thumbnail_number = 1
from pathlib import Path

import matplotlib.pyplot as plt
import numpy as np
import pandas as pd

from habit.contracts import Cohort, cohort_from_directory
from habit.datasets import fetch_demo
from habit.habitat_model import KMeansHabitatModelFitter
from habit.kernels import habitat_volume_fractions
from habit.pipeline import voxel_units
from habit.precision import align_habitat_maps_to_prototypes
from habit.viz import plot_prototype_matching
from habit.voxel_features import ExpressionVoxelFeatures

# Change DATA / MODALITIES / ROI and the expressions to your own layout.
DATA = fetch_demo()
MODALITIES = ("pre_contrast", "LAP", "PVP")
ROI = "LAP"
cohort = cohort_from_directory(DATA, modalities=MODALITIES, roi=ROI)
extractor = ExpressionVoxelFeatures(
    features={
        "rel_enh_lap": "(LAP - pre_contrast) / (pre_contrast + eps)",
        "rel_enh_pvp": "(PVP - pre_contrast) / (pre_contrast + eps)",
    },
    roi=ROI,
)

maps, models = [], []
for subject in cohort:
    units = voxel_units(extractor(subject))
    fitter = KMeansHabitatModelFitter(
        min_habitats=2, max_habitats=5, validation="silhouette", n_init=3
    )
    fitter.set_random_state(0)
    model = fitter.fit([units], cohort=Cohort([subject], name=subject.subject_id))
    maps.append(model.assigner()(units))
    models.append(model)
# Shared names for all five subjects, from their fitted centroids.
matched = align_habitat_maps_to_prototypes(maps, models=models)


def cohort_table(habitat_maps, centroid_rows) -> pd.DataFrame:
    """One row per subject: volume fraction and mean arterial enhancement per id.

    Args:
        habitat_maps: One HabitatMap per subject (raw or matched ids).
        centroid_rows: Per subject, ``{habitat_id: centroid row}`` in the
            same ids as the map.

    Returns:
        pd.DataFrame: Columns ``H{k}_volume`` and ``H{k}_enh_lap``; a
        habitat a subject does not have is volume 0 and enhancement NaN.
    """
    ids = sorted({k for rows in centroid_rows for k in rows})
    records = []
    for habitat_map, rows in zip(habitat_maps, centroid_rows):
        fractions = habitat_volume_fractions(habitat_map.label_array, ids)
        record = {"subject": habitat_map.subject_id}
        for k in ids:
            record[f"H{k}_volume"] = round(fractions[k], 3)
            record[f"H{k}_enh_lap"] = round(float(rows[k][0]), 3) if k in rows else np.nan
        records.append(record)
    return pd.DataFrame(records).set_index("subject")
HABIT demo data (cached)
DATA (preprocessed root): C:\Users\dongm\.habit_data\demo-data-v1\preprocessed

On-disk inventory of this folder:
  subjects (5): subj001, subj002, subj003, subj004, subj005
  image series: LAP, PVP, delay_3min, pre_contrast
  mask keys:    LAP, PVP, delay_3min, pre_contrast
  example image: images/subj001/delay_3min/WATER__BH_Ax_LAVA_Flex_3min_Series0012.nrrd
  example mask:  masks/subj001/delay_3min/WATER__BH_Ax_LAVA_Flex_10min_Series0017_mask.nrrd

Your own data must use the same folder tree (change IDs / series names):

  DATA/
    images/<subject_id>/<modality>/<one image file>
    masks/<subject_id>/<roi>/<one mask file>

Then load it with the same call the demos use:

  cohort = cohort_from_directory(DATA, modalities=("LAP",), roi="LAP")

Swap DATA / modalities / roi to match your tree. Mask key is often the
same as one image series (here LAP).
The same table, raw ids vs matched ids
Raw: habitat k is row k of each subject’s own centroids.
Matched: the assignment table says which prototype id each habitat got.
raw_rows = [{k + 1: row for k, row in enumerate(np.asarray(m.centroids))} for m in models]
matched_rows = []
for subject_id, model in zip(matched.assignments.subject_id.unique(), models):
    part = matched.assignments[matched.assignments.subject_id == subject_id]
    centroids = np.asarray(model.centroids)
    matched_rows.append(
        {int(p): centroids[int(h) - 1] for h, p in zip(part.habitat_id, part.prototype_id)}
    )

raw_table = cohort_table(maps, raw_rows)
matched_table = cohort_table(matched.habitat_maps, matched_rows)
print("raw ids\n", raw_table.to_string(), "\n")
print("matched ids\n", matched_table.to_string())
raw ids
          H1_volume  H1_enh_lap  H2_volume  H2_enh_lap  H3_volume  H3_enh_lap
subject
subj001      0.206       1.484      0.406       0.980      0.387       1.616
subj002      0.609       2.195      0.391       0.858      0.000         NaN
subj003      0.383       0.618      0.617       0.297      0.000         NaN
subj004      0.508       0.836      0.492       1.425      0.000         NaN
subj005      0.342       3.211      0.658       2.040      0.000         NaN

matched ids
          H1_volume  H1_enh_lap  H2_volume  H2_enh_lap  H3_volume  H3_enh_lap
subject
subj001      0.406       0.980      0.387       1.616      0.206       1.484
subj002      0.391       0.858      0.609       2.195      0.000         NaN
subj003      0.617       0.297      0.383       0.618      0.000         NaN
subj004      0.508       0.836      0.492       1.425      0.000         NaN
subj005      0.000         NaN      0.658       2.040      0.342       3.211
Spread of the enhancement columns across subjects. With raw ids a column mixes weakly and strongly enhancing habitats. After matching a column gathers the habitats closest to one prototype; what spread remains is between-subject variation plus habitats that resemble no prototype well but still had to take a name (one-to-one matching never merges two habitats of a subject). The last section shows how to find those.
Path("out").mkdir(exist_ok=True)
fig, axes = plt.subplots(1, 2, figsize=(8.4, 3.6), sharey=True)
for ax, (label, table) in zip(axes, (("raw ids", raw_table), ("matched ids", matched_table))):
    columns = [c for c in table.columns if c.endswith("_enh_lap")]
    for x, column in enumerate(columns):
        values = table[column].dropna().to_numpy()
        ax.scatter(np.full(values.size, x), values, s=36, color="#0072B2", alpha=0.8)
        ax.plot([x - 0.25, x + 0.25], [values.mean()] * 2, color="black", linewidth=1.5)
    ax.set_xticks(range(len(columns)))
    ax.set_xticklabels([c.split("_")[0] for c in columns])
    ax.set_title(f"{label}: column spread")
    ax.grid(True, axis="y", alpha=0.25)
axes[0].set_ylabel("mean arterial enhancement (per subject)")
fig.tight_layout()
fig.savefig("out/downstream_column_spread.png", dpi=150, bbox_inches="tight")
plt.show()

spread = pd.DataFrame(
    {
        "raw_ids_sd": raw_table.filter(like="_enh_lap").std(),
        "matched_ids_sd": matched_table.filter(like="_enh_lap").std(),
    }
).round(3)
print(spread)
spread
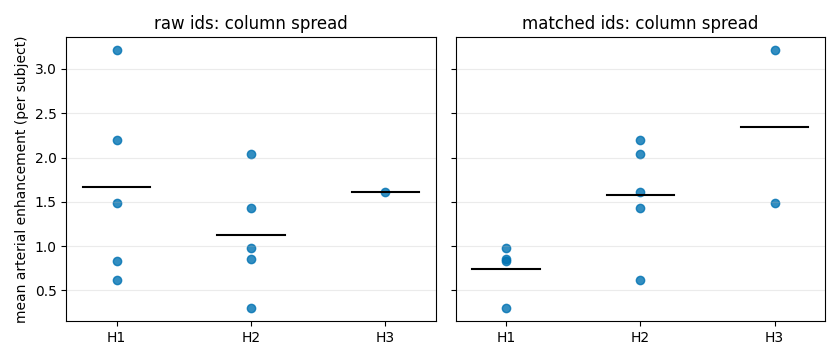
            raw_ids_sd  matched_ids_sd
H1_enh_lap       1.059           0.304
H2_enh_lap       0.653           0.621
H3_enh_lap         NaN           1.221
Leaving outliers unnamed with max_distance
By default every habitat is named, however far it is from its
prototype. With max_distance (Euclidean, in feature units) a habitat
farther than that from every free prototype keeps a subject-local id
above K and prototype_id NA. It then belongs to no shared
column. Off by default: when set, report how many habitats it removed.
strict = align_habitat_maps_to_prototypes(maps, models=models, max_distance=1.0)
unnamed = strict.assignments[strict.assignments.prototype_id.isna()]
print(unnamed.to_string(index=False))
K = strict.prototypes.shape[0]
for habitat_map in strict.habitat_maps:
    local = [k for k in habitat_map.habitat_ids if k > K]
    if local:
        print(f"{habitat_map.subject_id}: ids {local} are subject-local (not a cohort column)")

fig = plot_prototype_matching([np.asarray(m.centroids) for m in models], strict)
fig.savefig("out/downstream_max_distance.png", dpi=150, bbox_inches="tight")
plt.show()
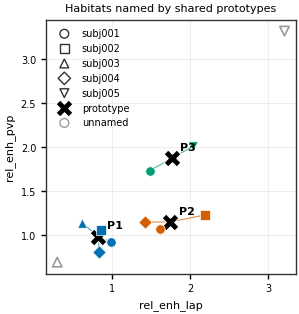
subject_id  habitat_id  prototype_id  distance
   subj003           2          <NA>       NaN
   subj005           1          <NA>       NaN
subj003: ids [4] are subject-local (not a cohort column)
subj005: ids [4] are subject-local (not a cohort column)
Total running time of the script: (0 minutes 33.703 seconds)