Graph features
Background. A habitat map can also be read as a network: small pieces
of habitat are the nodes, and pieces lying close together are linked. Network
statistics then describe whether a habitat is one well-connected mass or a
scatter of isolated islands, and how two habitats interleave.
Purpose. You get one row of graph features per subject: first from the
study (before id alignment), then from the kernel function and from the
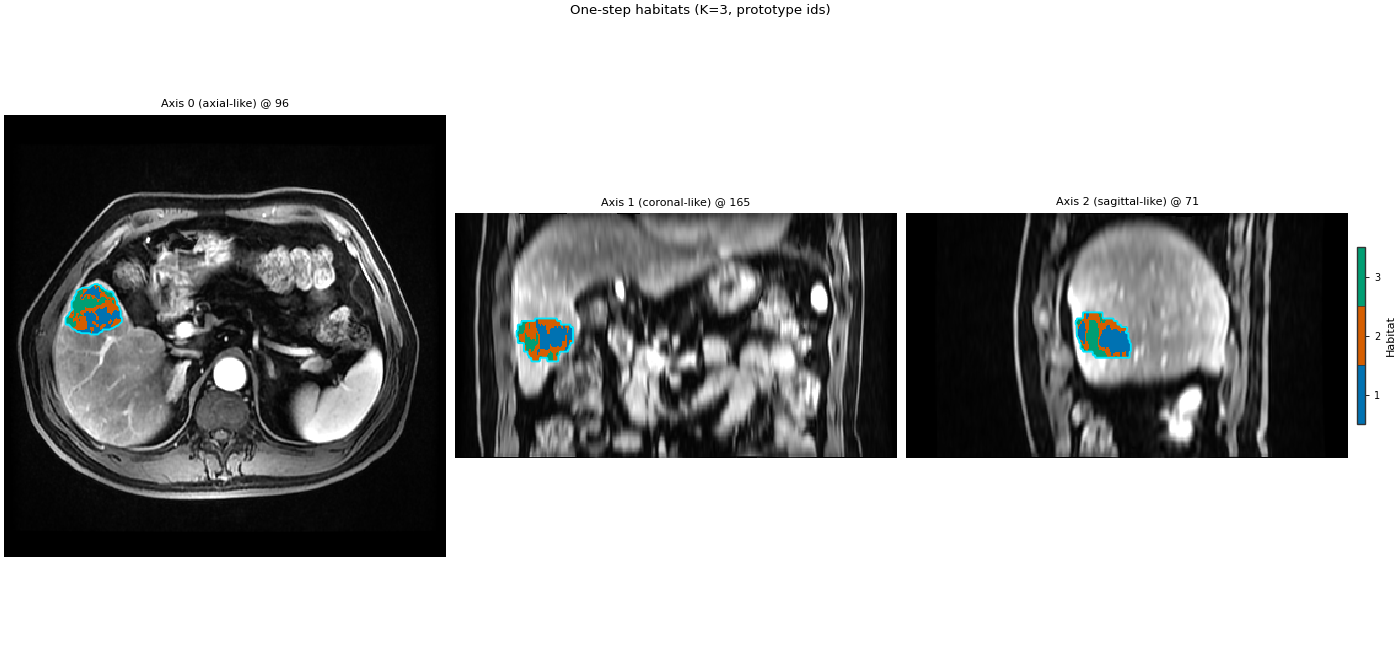
component after aligning habitat ids across the two subjects. Overlay,
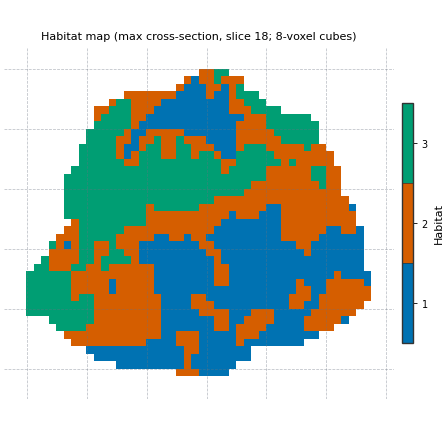
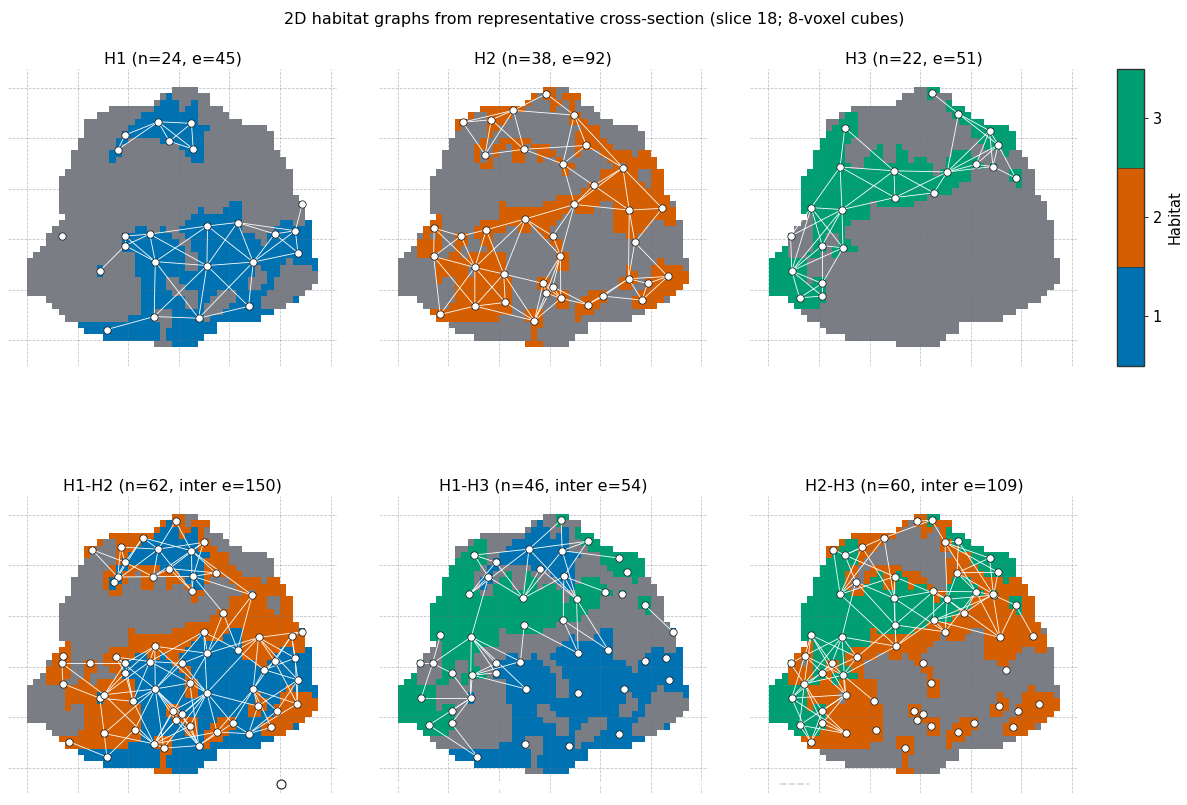
lattice and network figures show one slice.
Key terms.
node – the tumour bounding box is cut into cubes of block_size
voxels per side (8 here); inside each cube, every connected piece of a
habitat becomes one node, placed at that piece’s centroid.
edge – two nodes are linked when their closest voxels are at most
distance_threshold voxels apart (default 5, in voxels, not mm).
single / pair graph – single_h* columns use the nodes of one
habitat; pair_h*_* columns use the nodes of two habitats together.
Each graph yields statistics such as n_nodes, n_edges,
avg_degree and avg_edge_distance.
one-step habitats / matching – see
Defining habitats inside each subject and
Matching habitat labels across subjects.
After a habitat map exists, extract_graph_features()
summarises region topology (lattice nodes, closest-voxel edges).
The same family is available as the scikit-learn-style component
GraphHabitatFeatures, or as
Spec("graph") on a study.
Cross-tumour id alignment. With one_step clustering each subject
is clustered independently, so integer habitat ids are permuted across
patients: cluster 1 in subject A need not be the same phenotype as
cluster 1 in subject B. Before extracting subject-level features that
name habitats (especially graph columns single_h*, pair_h*_*),
name every subject against shared prototypes with
align_habitat_maps_to_prototypes(). Only then does
single_h1 mean the same habitat across the cohort. Method and
caveats: Matching habitat labels across subjects and
Matching habitat labels across fits and subjects.
2-D network figures are display-only (one representative slice). Tables
use the full 3-D HabitatMap.
One-step habitats with a known K so the graph has a fixed number of
labels. Graph option fields are passed as flat kwargs — no separate
options object is required.
sphinx_gallery_thumbnail_number = 3
from pathlib import Path

import matplotlib.pyplot as plt
import pandas as pd

from habit.contracts import cohort_from_directory
from habit.datasets import fetch_demo
from habit.habitat_features import GraphHabitatFeatures
from habit.kernels import extract_graph_features
from habit.precision import align_habitat_maps_to_prototypes
from habit.recipes import one_step_habitat
from habit.spec import Spec
from habit.viz import (
    plot_habitat_graph_network_2d,
    plot_habitat_graph_slice,
    plot_habitat_overlay,
)

DATA = fetch_demo()
MODALITIES = ("LAP",)
ROI = "LAP"
cohort = cohort_from_directory(DATA, modalities=MODALITIES, roi=ROI)[:2]
print(f"Cohort: {list(cohort.subject_ids)}")

result = one_step_habitat(
    modalities=MODALITIES,
    n_habitats=3,
    random_seed=0,
    roi=ROI,
    # Quantify inside the study: volume plus graph features. Extended
    # metrics (efficiency, small-world, ...) are switched off to stay short.
    habitat_features=[
        "volume",
        Spec("graph", {"include_extended_metrics": False}),
    ],
).fit_predict(cohort)
print("Study graph columns before cross-tumour alignment (head):")
print(result.features.frame.head())
result.features.frame.head()
HABIT demo data (cached)
DATA (preprocessed root): C:\Users\dongm\.habit_data\demo-data-v1\preprocessed

On-disk inventory of this folder:
  subjects (5): subj001, subj002, subj003, subj004, subj005
  image series: LAP, PVP, delay_3min, pre_contrast
  mask keys:    LAP, PVP, delay_3min, pre_contrast
  example image: images/subj001/delay_3min/WATER__BH_Ax_LAVA_Flex_3min_Series0012.nrrd
  example mask:  masks/subj001/delay_3min/WATER__BH_Ax_LAVA_Flex_10min_Series0017_mask.nrrd

Your own data must use the same folder tree (change IDs / series names):

  DATA/
    images/<subject_id>/<modality>/<one image file>
    masks/<subject_id>/<roi>/<one mask file>

Then load it with the same call the demos use:

  cohort = cohort_from_directory(DATA, modalities=("LAP",), roi="LAP")

Swap DATA / modalities / roi to match your tree. Mask key is often the
same as one image series (here LAP).
Cohort: ['subj001', 'subj002']

Cohort.map[_DefineAndLabelWithinSubject]:   0%|          | 0/2 [00:00<?, ?it/s]
Cohort.map[_DefineAndLabelWithinSubject]:  50%|█████     | 1/2 [00:01<00:01,  1.72s/it]
Cohort.map[_DefineAndLabelWithinSubject]: 100%|██████████| 2/2 [00:03<00:00,  1.58s/it]
Cohort.map[_DefineAndLabelWithinSubject]: 100%|██████████| 2/2 [00:03<00:00,  1.58s/it]
Study graph columns before cross-tumour alignment (head):
   subject  ...  pair_h2_h3_contact_voxels_sum_per_pair_area_scale
0  subj001  ...                                                0.0
1  subj002  ...                                                0.0

[2 rows x 259 columns]
|
subject |
habitat_1_voxel_count |
habitat_1_volume_fraction |
habitat_2_voxel_count |
habitat_2_volume_fraction |
habitat_3_voxel_count |
habitat_3_volume_fraction |
graph_num_habitats |
graph_num_nodes_total |
single_h1_n_nodes |
single_h1_n_edges |
single_h1_edge_density |
single_h1_connected_components |
single_h1_avg_degree |
single_h1_max_degree |
single_h1_min_degree |
single_h1_avg_degree_norm |
single_h1_max_degree_norm |
single_h1_min_degree_norm |
single_h1_degree_cv |
single_h1_degree_entropy |
single_h1_avg_edge_distance |
single_h1_std_edge_distance |
single_h1_avg_node_voxels |
single_h1_std_node_voxels |
single_h1_node_voxels_cv |
single_h1_spatial_dispersion |
single_h1_connected_components_ratio |
single_h1_nearest_neighbor_ratio |
single_h1_modularity |
single_h1_largest_component_ratio |
single_h1_avg_clustering |
single_h1_avg_path_length |
single_h1_diameter |
single_h1_avg_path_length_norm |
single_h1_diameter_norm |
single_h1_avg_betweenness |
single_h1_avg_closeness |
single_h1_degree_assortativity |
single_h2_n_nodes |
... |
single_h3_std_edge_distance_per_habitat_bbox_diagonal |
single_h3_avg_node_voxels_norm |
single_h3_avg_node_voxels_fraction |
single_h3_std_node_voxels_norm |
single_h3_std_node_voxels_fraction |
single_h3_spatial_dispersion_norm |
single_h3_spatial_dispersion_per_habitat_bbox_diagonal |
pair_h1_h2_n_nodes_1_norm |
pair_h1_h2_n_nodes_1_per_habitat_volume |
pair_h1_h2_n_nodes_2_norm |
pair_h1_h2_n_nodes_2_per_habitat_volume |
pair_h1_h2_n_edges_norm |
pair_h1_h2_avg_edge_distance_norm |
pair_h1_h2_avg_edge_distance_per_pair_bbox_diagonal |
pair_h1_h2_std_edge_distance_norm |
pair_h1_h2_std_edge_distance_per_pair_bbox_diagonal |
pair_h1_h2_contact_voxels_sum_norm |
pair_h1_h2_contact_voxels_sum_per_pair_area_scale |
pair_h1_h3_n_nodes_1_norm |
pair_h1_h3_n_nodes_1_per_habitat_volume |
pair_h1_h3_n_nodes_2_norm |
pair_h1_h3_n_nodes_2_per_habitat_volume |
pair_h1_h3_n_edges_norm |
pair_h1_h3_avg_edge_distance_norm |
pair_h1_h3_avg_edge_distance_per_pair_bbox_diagonal |
pair_h1_h3_std_edge_distance_norm |
pair_h1_h3_std_edge_distance_per_pair_bbox_diagonal |
pair_h1_h3_contact_voxels_sum_norm |
pair_h1_h3_contact_voxels_sum_per_pair_area_scale |
pair_h2_h3_n_nodes_1_norm |
pair_h2_h3_n_nodes_1_per_habitat_volume |
pair_h2_h3_n_nodes_2_norm |
pair_h2_h3_n_nodes_2_per_habitat_volume |
pair_h2_h3_n_edges_norm |
pair_h2_h3_avg_edge_distance_norm |
pair_h2_h3_avg_edge_distance_per_pair_bbox_diagonal |
pair_h2_h3_std_edge_distance_norm |
pair_h2_h3_std_edge_distance_per_pair_bbox_diagonal |
pair_h2_h3_contact_voxels_sum_norm |
pair_h2_h3_contact_voxels_sum_per_pair_area_scale |
| 0 |
subj001 |
14252.0 |
0.410791 |
10030.0 |
0.289099 |
10412.0 |
0.300110 |
3.0 |
334.0 |
126.0 |
740.0 |
0.093968 |
1.0 |
11.746032 |
24.0 |
2.0 |
0.093968 |
0.192000 |
0.016000 |
0.482425 |
4.342367 |
2.086674 |
1.211369 |
108.539683 |
105.271957 |
0.969894 |
9.665807 |
0.007937 |
1.802005 |
0.357904 |
1.0 |
0.627344 |
2.900190 |
6.0 |
0.023202 |
0.048000 |
0.015324 |
0.350994 |
0.090758 |
113.0 |
... |
0.013795 |
0.003042 |
0.010135 |
0.003392 |
0.011304 |
0.122541 |
0.126469 |
0.003632 |
0.008841 |
0.003257 |
0.011266 |
0.036346 |
0.028672 |
0.029120 |
0.01573 |
0.015976 |
0.0 |
0.0 |
0.003632 |
0.008841 |
0.002738 |
0.009124 |
0.032484 |
0.028411 |
0.028861 |
0.015457 |
0.015702 |
0.0 |
0.0 |
0.003257 |
0.011266 |
0.002738 |
0.009124 |
0.018533 |
0.041079 |
0.041079 |
0.013518 |
0.013518 |
0.0 |
0.0 |
| 1 |
subj002 |
4182.0 |
0.424224 |
2049.0 |
0.207851 |
3627.0 |
0.367925 |
3.0 |
117.0 |
29.0 |
146.0 |
0.359606 |
1.0 |
10.068966 |
20.0 |
3.0 |
0.359606 |
0.714286 |
0.107143 |
0.386789 |
3.650410 |
1.918283 |
1.081437 |
138.931034 |
112.217440 |
0.807720 |
5.912795 |
0.034483 |
1.697838 |
0.161874 |
1.0 |
0.717085 |
1.800493 |
3.0 |
0.064303 |
0.107143 |
0.029648 |
0.568555 |
0.010976 |
38.0 |
... |
0.024078 |
0.007016 |
0.019068 |
0.008709 |
0.023671 |
0.129730 |
0.136653 |
0.002942 |
0.006934 |
0.003855 |
0.018546 |
0.020998 |
0.064621 |
0.064621 |
0.02041 |
0.020410 |
0.0 |
0.0 |
0.002942 |
0.006934 |
0.005072 |
0.013785 |
0.040779 |
0.044726 |
0.047113 |
0.024173 |
0.025463 |
0.0 |
0.0 |
0.003855 |
0.018546 |
0.005072 |
0.013785 |
0.030229 |
0.047706 |
0.047706 |
0.026986 |
0.026986 |
0.0 |
0.0 |
2 rows × 259 columns
Name every subject’s habitats against shared prototypes so habitat
integers mean one phenotype across the cohort. models= reads each
subject’s fitted clustering centroids. This demo clusters raw LAP to
stay short; in a real study cluster on features that are comparable
across patients (see the matching page).
  subject_id  habitat_id  prototype_id   distance
0    subj001           1             2  17.091447
1    subj001           2             3  43.714502
2    subj001           3             1  39.411305
3    subj002           1             3  43.714502
4    subj002           2             1  39.411305
5    subj002           3             2  17.091447
Two idiomatic extraction paths on the aligned full 3-D label arrays.
Do not extract from a 2-D slice — the network figure is display-only.
Direct kernel function with flat kwargs (sklearn-style keyword API):
Kernel extract_graph_features (flat kwargs) after alignment:
  subject_id  ...  pair_h2_h3_contact_voxels_sum_per_pair_area_scale
0    subj001  ...                                                0.0
1    subj002  ...                                                0.0

[2 rows x 253 columns]
|
subject_id |
graph_num_habitats |
graph_num_nodes_total |
single_h1_n_nodes |
single_h1_n_edges |
single_h1_edge_density |
single_h1_connected_components |
single_h1_avg_degree |
single_h1_max_degree |
single_h1_min_degree |
single_h1_avg_degree_norm |
single_h1_max_degree_norm |
single_h1_min_degree_norm |
single_h1_degree_cv |
single_h1_degree_entropy |
single_h1_avg_edge_distance |
single_h1_std_edge_distance |
single_h1_avg_node_voxels |
single_h1_std_node_voxels |
single_h1_node_voxels_cv |
single_h1_spatial_dispersion |
single_h1_connected_components_ratio |
single_h1_nearest_neighbor_ratio |
single_h1_modularity |
single_h1_largest_component_ratio |
single_h1_avg_clustering |
single_h1_avg_path_length |
single_h1_diameter |
single_h1_avg_path_length_norm |
single_h1_diameter_norm |
single_h1_avg_betweenness |
single_h1_avg_closeness |
single_h1_degree_assortativity |
single_h2_n_nodes |
single_h2_n_edges |
single_h2_edge_density |
single_h2_connected_components |
single_h2_avg_degree |
single_h2_max_degree |
single_h2_min_degree |
... |
single_h3_std_edge_distance_per_habitat_bbox_diagonal |
single_h3_avg_node_voxels_norm |
single_h3_avg_node_voxels_fraction |
single_h3_std_node_voxels_norm |
single_h3_std_node_voxels_fraction |
single_h3_spatial_dispersion_norm |
single_h3_spatial_dispersion_per_habitat_bbox_diagonal |
pair_h1_h2_n_nodes_1_norm |
pair_h1_h2_n_nodes_1_per_habitat_volume |
pair_h1_h2_n_nodes_2_norm |
pair_h1_h2_n_nodes_2_per_habitat_volume |
pair_h1_h2_n_edges_norm |
pair_h1_h2_avg_edge_distance_norm |
pair_h1_h2_avg_edge_distance_per_pair_bbox_diagonal |
pair_h1_h2_std_edge_distance_norm |
pair_h1_h2_std_edge_distance_per_pair_bbox_diagonal |
pair_h1_h2_contact_voxels_sum_norm |
pair_h1_h2_contact_voxels_sum_per_pair_area_scale |
pair_h1_h3_n_nodes_1_norm |
pair_h1_h3_n_nodes_1_per_habitat_volume |
pair_h1_h3_n_nodes_2_norm |
pair_h1_h3_n_nodes_2_per_habitat_volume |
pair_h1_h3_n_edges_norm |
pair_h1_h3_avg_edge_distance_norm |
pair_h1_h3_avg_edge_distance_per_pair_bbox_diagonal |
pair_h1_h3_std_edge_distance_norm |
pair_h1_h3_std_edge_distance_per_pair_bbox_diagonal |
pair_h1_h3_contact_voxels_sum_norm |
pair_h1_h3_contact_voxels_sum_per_pair_area_scale |
pair_h2_h3_n_nodes_1_norm |
pair_h2_h3_n_nodes_1_per_habitat_volume |
pair_h2_h3_n_nodes_2_norm |
pair_h2_h3_n_nodes_2_per_habitat_volume |
pair_h2_h3_n_edges_norm |
pair_h2_h3_avg_edge_distance_norm |
pair_h2_h3_avg_edge_distance_per_pair_bbox_diagonal |
pair_h2_h3_std_edge_distance_norm |
pair_h2_h3_std_edge_distance_per_pair_bbox_diagonal |
pair_h2_h3_contact_voxels_sum_norm |
pair_h2_h3_contact_voxels_sum_per_pair_area_scale |
| 0 |
subj001 |
3.0 |
334.0 |
95.0 |
464.0 |
0.103919 |
7.0 |
9.768421 |
28.0 |
0.0 |
0.103919 |
0.297872 |
0.000000 |
0.628858 |
4.220650 |
1.855271 |
1.036924 |
105.526316 |
117.693075 |
1.115296 |
9.506213 |
0.073684 |
1.744899 |
0.333729 |
0.757895 |
0.688678 |
2.495696 |
5.0 |
0.035151 |
0.070423 |
0.021367 |
0.412782 |
0.228815 |
126.0 |
740.0 |
0.093968 |
1.0 |
11.746032 |
24.0 |
2.0 |
... |
0.017833 |
0.002410 |
0.008338 |
0.003223 |
0.011149 |
0.123149 |
0.134502 |
0.002738 |
0.009124 |
0.003632 |
0.008841 |
0.032484 |
0.028411 |
0.028861 |
0.015457 |
0.015702 |
0.0 |
0.0 |
0.002738 |
0.009124 |
0.003257 |
0.011266 |
0.018533 |
0.041079 |
0.041079 |
0.013518 |
0.013518 |
0.0 |
0.0 |
0.003632 |
0.008841 |
0.003257 |
0.011266 |
0.036346 |
0.028672 |
0.029120 |
0.015730 |
0.015976 |
0.0 |
0.0 |
| 1 |
subj002 |
3.0 |
117.0 |
38.0 |
100.0 |
0.142248 |
2.0 |
5.263158 |
12.0 |
1.0 |
0.142248 |
0.324324 |
0.027027 |
0.554256 |
3.039295 |
2.142576 |
1.252744 |
46.421053 |
65.739370 |
1.416154 |
7.016904 |
0.052632 |
2.061053 |
0.326150 |
0.947368 |
0.630415 |
3.746032 |
9.0 |
0.107029 |
0.257143 |
0.080766 |
0.280431 |
0.196283 |
50.0 |
242.0 |
0.197551 |
1.0 |
9.680000 |
24.0 |
1.0 |
... |
0.024540 |
0.014093 |
0.033221 |
0.011383 |
0.026833 |
0.122520 |
0.134174 |
0.003855 |
0.018546 |
0.005072 |
0.013785 |
0.030229 |
0.047706 |
0.047706 |
0.026986 |
0.026986 |
0.0 |
0.0 |
0.003855 |
0.018546 |
0.002942 |
0.006934 |
0.020998 |
0.064621 |
0.064621 |
0.020410 |
0.020410 |
0.0 |
0.0 |
0.005072 |
0.013785 |
0.002942 |
0.006934 |
0.040779 |
0.044726 |
0.047113 |
0.024173 |
0.025463 |
0.0 |
0.0 |
2 rows × 253 columns
Scikit-learn style component — construct once, call per subject:
GraphHabitatFeatures component (same options as constructor):
   subject  ...  pair_h2_h3_contact_voxels_sum_per_pair_area_scale
0  subj001  ...                                                0.0
1  subj002  ...                                                0.0

[2 rows x 253 columns]
|
subject |
graph_num_habitats |
graph_num_nodes_total |
single_h1_n_nodes |
single_h1_n_edges |
single_h1_edge_density |
single_h1_connected_components |
single_h1_avg_degree |
single_h1_max_degree |
single_h1_min_degree |
single_h1_avg_degree_norm |
single_h1_max_degree_norm |
single_h1_min_degree_norm |
single_h1_degree_cv |
single_h1_degree_entropy |
single_h1_avg_edge_distance |
single_h1_std_edge_distance |
single_h1_avg_node_voxels |
single_h1_std_node_voxels |
single_h1_node_voxels_cv |
single_h1_spatial_dispersion |
single_h1_connected_components_ratio |
single_h1_nearest_neighbor_ratio |
single_h1_modularity |
single_h1_largest_component_ratio |
single_h1_avg_clustering |
single_h1_avg_path_length |
single_h1_diameter |
single_h1_avg_path_length_norm |
single_h1_diameter_norm |
single_h1_avg_betweenness |
single_h1_avg_closeness |
single_h1_degree_assortativity |
single_h2_n_nodes |
single_h2_n_edges |
single_h2_edge_density |
single_h2_connected_components |
single_h2_avg_degree |
single_h2_max_degree |
single_h2_min_degree |
... |
single_h3_std_edge_distance_per_habitat_bbox_diagonal |
single_h3_avg_node_voxels_norm |
single_h3_avg_node_voxels_fraction |
single_h3_std_node_voxels_norm |
single_h3_std_node_voxels_fraction |
single_h3_spatial_dispersion_norm |
single_h3_spatial_dispersion_per_habitat_bbox_diagonal |
pair_h1_h2_n_nodes_1_norm |
pair_h1_h2_n_nodes_1_per_habitat_volume |
pair_h1_h2_n_nodes_2_norm |
pair_h1_h2_n_nodes_2_per_habitat_volume |
pair_h1_h2_n_edges_norm |
pair_h1_h2_avg_edge_distance_norm |
pair_h1_h2_avg_edge_distance_per_pair_bbox_diagonal |
pair_h1_h2_std_edge_distance_norm |
pair_h1_h2_std_edge_distance_per_pair_bbox_diagonal |
pair_h1_h2_contact_voxels_sum_norm |
pair_h1_h2_contact_voxels_sum_per_pair_area_scale |
pair_h1_h3_n_nodes_1_norm |
pair_h1_h3_n_nodes_1_per_habitat_volume |
pair_h1_h3_n_nodes_2_norm |
pair_h1_h3_n_nodes_2_per_habitat_volume |
pair_h1_h3_n_edges_norm |
pair_h1_h3_avg_edge_distance_norm |
pair_h1_h3_avg_edge_distance_per_pair_bbox_diagonal |
pair_h1_h3_std_edge_distance_norm |
pair_h1_h3_std_edge_distance_per_pair_bbox_diagonal |
pair_h1_h3_contact_voxels_sum_norm |
pair_h1_h3_contact_voxels_sum_per_pair_area_scale |
pair_h2_h3_n_nodes_1_norm |
pair_h2_h3_n_nodes_1_per_habitat_volume |
pair_h2_h3_n_nodes_2_norm |
pair_h2_h3_n_nodes_2_per_habitat_volume |
pair_h2_h3_n_edges_norm |
pair_h2_h3_avg_edge_distance_norm |
pair_h2_h3_avg_edge_distance_per_pair_bbox_diagonal |
pair_h2_h3_std_edge_distance_norm |
pair_h2_h3_std_edge_distance_per_pair_bbox_diagonal |
pair_h2_h3_contact_voxels_sum_norm |
pair_h2_h3_contact_voxels_sum_per_pair_area_scale |
| 0 |
subj001 |
3.0 |
334.0 |
95.0 |
464.0 |
0.103919 |
7.0 |
9.768421 |
28.0 |
0.0 |
0.103919 |
0.297872 |
0.000000 |
0.628858 |
4.220650 |
1.855271 |
1.036924 |
105.526316 |
117.693075 |
1.115296 |
9.506213 |
0.073684 |
1.744899 |
0.333729 |
0.757895 |
0.688678 |
2.495696 |
5.0 |
0.035151 |
0.070423 |
0.021367 |
0.412782 |
0.228815 |
126.0 |
740.0 |
0.093968 |
1.0 |
11.746032 |
24.0 |
2.0 |
... |
0.017833 |
0.002410 |
0.008338 |
0.003223 |
0.011149 |
0.123149 |
0.134502 |
0.002738 |
0.009124 |
0.003632 |
0.008841 |
0.032484 |
0.028411 |
0.028861 |
0.015457 |
0.015702 |
0.0 |
0.0 |
0.002738 |
0.009124 |
0.003257 |
0.011266 |
0.018533 |
0.041079 |
0.041079 |
0.013518 |
0.013518 |
0.0 |
0.0 |
0.003632 |
0.008841 |
0.003257 |
0.011266 |
0.036346 |
0.028672 |
0.029120 |
0.015730 |
0.015976 |
0.0 |
0.0 |
| 1 |
subj002 |
3.0 |
117.0 |
38.0 |
100.0 |
0.142248 |
2.0 |
5.263158 |
12.0 |
1.0 |
0.142248 |
0.324324 |
0.027027 |
0.554256 |
3.039295 |
2.142576 |
1.252744 |
46.421053 |
65.739370 |
1.416154 |
7.016904 |
0.052632 |
2.061053 |
0.326150 |
0.947368 |
0.630415 |
3.746032 |
9.0 |
0.107029 |
0.257143 |
0.080766 |
0.280431 |
0.196283 |
50.0 |
242.0 |
0.197551 |
1.0 |
9.680000 |
24.0 |
1.0 |
... |
0.024540 |
0.014093 |
0.033221 |
0.011383 |
0.026833 |
0.122520 |
0.134174 |
0.003855 |
0.018546 |
0.005072 |
0.013785 |
0.030229 |
0.047706 |
0.047706 |
0.026986 |
0.026986 |
0.0 |
0.0 |
0.003855 |
0.018546 |
0.002942 |
0.006934 |
0.020998 |
0.064621 |
0.064621 |
0.020410 |
0.020410 |
0.0 |
0.0 |
0.005072 |
0.013785 |
0.002942 |
0.006934 |
0.040779 |
0.044726 |
0.047113 |
0.024173 |
0.025463 |
0.0 |
0.0 |
2 rows × 253 columns
Overlay, lattice slice, and 2-D network — also flat kwargs, no options object.
block_size=8 is the library default for both extraction and display.
Path("out").mkdir(exist_ok=True)
labels = aligned_maps[0].label_array
fig = plot_habitat_overlay(
    cohort[0].image(MODALITIES[0]),
    aligned_maps[0],
    title="One-step habitats (K=3, prototype ids)",
)
fig.savefig("out/graph_habitat_slice_2d.png", dpi=150, bbox_inches="tight")
plt.show()

fig_slice = plot_habitat_graph_slice(
    labels,
    block_size=8,
    show_grid=True,
    grid_linestyle="--",
)
fig_slice.savefig("out/graph_habitat_lattice_2d.png", dpi=150, bbox_inches="tight")
plt.show()

fig_net = plot_habitat_graph_network_2d(
    labels,
    block_size=8,
    show_grid=True,
    grid_linestyle="--",
)
if fig_net is not None:
    fig_net.savefig("out/graph_habitat_network_2d.png", dpi=150, bbox_inches="tight")
    plt.show()
F:\work\habit_project\habit\viz\habitat_overlay.py:806: UserWarning: Display geometry conflict: image/anatomy direction does not match mask/label direction. Using the mask/label direction so coronal/sagittal superior-up follows the labelled anatomy. Pass direction= to override.
  resolved_direction, resolved_spacing = resolve_display_geometry(
Total running time of the script: (0 minutes 7.706 seconds)
Gallery generated by Sphinx-Gallery