Note
Go to the end to download the full example code.
Intratumoral heterogeneity (ITH)
Background. Intratumoral heterogeneity (ITH) describes how mixed a tumour is. Here it is measured from the habitat map as fragmentation: do habitats form a few compact blobs, or many scattered pieces?
Purpose. You get one ITH score for the whole tumour plus one dispersion value per habitat, as a table and a summary figure.
Key terms.
ITH score – intratumoral heterogeneity as fragmentation: 0 when each habitat is one connected blob, approaching 1 when habitats break into many small pieces. Formula:
1 - sum_i(S_i,max / n_i) / S_total, withS_i,maxthe largest piece of habitati,n_iits number of face-connected pieces andS_totalall non-background voxels.per-habitat dispersion – the same idea for one habitat,
1 - (S_i,max / n_i) / S_i; the ITH score is their volume-weighted mean.
Atomic ITH metrics from a habitat label map:
ith_score() and
habitat_ith_dispersion().
One-step habitats
Same idea as the complete analysis, without partition or pool, so one
subject is enough. one_step_habitat builds these stages:
extract Spec("raw"), fit Spec("kmeans", {"n_habitats": 3}),
assign Spec("nearest_centroid").
sphinx_gallery_thumbnail_number = 1
from pathlib import Path

import matplotlib.pyplot as plt
import pandas as pd

from habit.contracts import cohort_from_directory
from habit.datasets import fetch_demo
from habit.kernels import habitat_ith_dispersion, ith_score
from habit.recipes import one_step_habitat
from habit.viz import plot_ith_summary

DATA = fetch_demo()
MODALITIES = ("LAP",)
ROI = "LAP"
cohort = cohort_from_directory(DATA, modalities=MODALITIES, roi=ROI)[:1]
result = one_step_habitat(
    modalities=MODALITIES, n_habitats=3, random_seed=0, roi=ROI
).fit_predict(cohort)
labels = result.habitat_maps[0].label_array
HABIT demo data (cached)
DATA (preprocessed root): C:\Users\dongm\.habit_data\demo-data-v1\preprocessed

On-disk inventory of this folder:
  subjects (5): subj001, subj002, subj003, subj004, subj005
  image series: LAP, PVP, delay_3min, pre_contrast
  mask keys:    LAP, PVP, delay_3min, pre_contrast
  example image: images/subj001/delay_3min/WATER__BH_Ax_LAVA_Flex_3min_Series0012.nrrd
  example mask:  masks/subj001/delay_3min/WATER__BH_Ax_LAVA_Flex_10min_Series0017_mask.nrrd

Your own data must use the same folder tree (change IDs / series names):

  DATA/
    images/<subject_id>/<modality>/<one image file>
    masks/<subject_id>/<roi>/<one mask file>

Then load it with the same call the demos use:

  cohort = cohort_from_directory(DATA, modalities=("LAP",), roi="LAP")

Swap DATA / modalities / roi to match your tree. Mask key is often the
same as one image series (here LAP).

Cohort.map[_DefineAndLabelWithinSubject]:   0%|          | 0/1 [00:00<?, ?it/s]
Cohort.map[_DefineAndLabelWithinSubject]: 100%|██████████| 1/1 [00:01<00:00,  1.29s/it]
Cohort.map[_DefineAndLabelWithinSubject]: 100%|██████████| 1/1 [00:01<00:00,  1.29s/it]
ITH score and per-habitat dispersion
One tumour-level number, then one value per habitat id (same formula).
ith = float(ith_score(labels))
dispersion = habitat_ith_dispersion(labels)
ith_table = pd.DataFrame(
    [{"habitat": "ITH", "score": ith}]
    + [{"habitat": f"H{hid}", "score": float(val)} for hid, val in sorted(dispersion.items())]
)
print("ITH scores:")
print(ith_table.to_string(index=False))
ith_table

Path("out").mkdir(exist_ok=True)
fig_ith = plot_ith_summary(ith, dispersion=dispersion)
fig_ith.savefig("out/ith_summary.png", dpi=150, bbox_inches="tight")
plt.show()
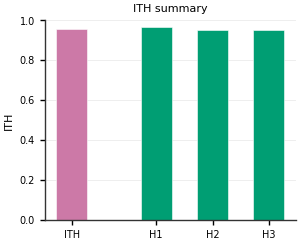
ITH scores:
habitat    score
    ITH 0.958465
     H1 0.965684
     H2 0.952647
     H3 0.954187
Total running time of the script: (0 minutes 1.823 seconds)