Note
Go to the end to download the full example code.
Matching maps of the same voxels by overlap
Background. When two habitat maps cover the same voxels, their ids can be matched by counting shared voxels alone, even if the two fits used a different number of habitats or different features.
Purpose. You see three matched comparisons on one demo subject (3 vs 4 habitats, two feature sets, five k-means restarts) and a per-habitat Dice plot that shows which habitats are stable over restarts.
Key terms.
label switching, overlap table, Hungarian assignment – see Why habitat ids must be matched.
restart – rerunning k-means with another random seed on the same data.
Dice – overlap between two label maps or regions (0 = none, 1 = identical).
Voxel overlap is the matcher whenever two maps label the same voxels:
a k-means restart, another k, another feature set, a perturbed image,
a second reader. It needs no features at all, only the two label images,
so it also works when the two fits live in different feature spaces.
Three cases on one subject:
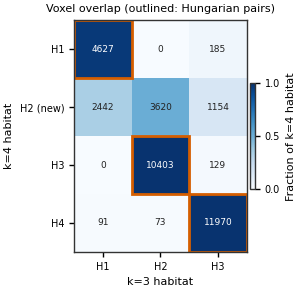
different k (3 vs 4): one moving habitat has no partner and gets a new id above the reference ids – nothing is merged;
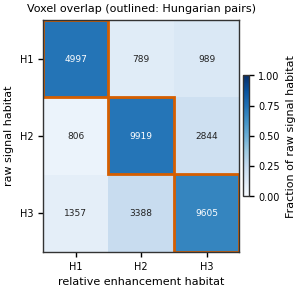
different features (raw intensities vs relative enhancement): centroids cannot be compared, overlap still can;
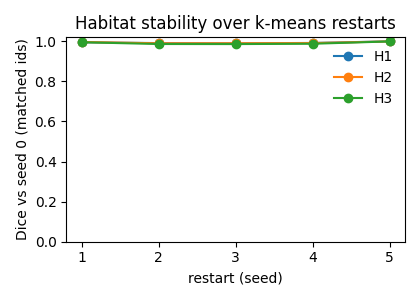
restart stability: Dice of every habitat over several seeds.
Overlap is not usable between two patients: their voxels are different tissue. See Prototype matching step by step.
One subject, two voxel feature sets
sphinx_gallery_thumbnail_number = 1
from pathlib import Path

import matplotlib.pyplot as plt
import numpy as np
import pandas as pd

from habit.contracts import Cohort, cohort_from_directory
from habit.datasets import fetch_demo
from habit.habitat_model import KMeansHabitatModelFitter
from habit.pipeline import voxel_units
from habit.precision import align_habitat_map, habitat_stability
from habit.viz import plot_habitat_label_compare, plot_label_overlap_matrix
from habit.voxel_features import ExpressionVoxelFeatures, RawVoxelFeatures

# Change DATA / MODALITIES / ROI and the expressions to your own layout.
DATA = fetch_demo()
MODALITIES = ("pre_contrast", "LAP", "PVP")
ROI = "LAP"
subject = cohort_from_directory(DATA, modalities=MODALITIES, roi=ROI)[0]
enhancement = voxel_units(
    ExpressionVoxelFeatures(
        features={
            "rel_enh_lap": "(LAP - pre_contrast) / (pre_contrast + eps)",
            "rel_enh_pvp": "(PVP - pre_contrast) / (pre_contrast + eps)",
        },
        roi=ROI,
    )(subject)
)
# Second feature set on the same voxels: raw LAP / PVP signal, not ratios.
raw_signal = voxel_units(RawVoxelFeatures(modalities=("LAP", "PVP"), roi=ROI)(subject))


def fit_map(units, k: int, seed: int = 0):
    """Fit a per-subject k-means with ``k`` habitats and label the voxels.

    Args:
        units: Voxel units of one subject (from ``voxel_units``).
        k: Number of habitats.
        seed: k-means random seed.

    Returns:
        HabitatMap: The subject's habitat map.
    """
    fitter = KMeansHabitatModelFitter(n_habitats=k, n_init=1)
    fitter.set_random_state(seed)
    model = fitter.fit([units], cohort=Cohort([subject], name=subject.subject_id))
    return model.assigner()(units)


Path("out").mkdir(exist_ok=True)
image = subject.image(ROI)
HABIT demo data (cached)
DATA (preprocessed root): C:\Users\dongm\.habit_data\demo-data-v1\preprocessed

On-disk inventory of this folder:
  subjects (5): subj001, subj002, subj003, subj004, subj005
  image series: LAP, PVP, delay_3min, pre_contrast
  mask keys:    LAP, PVP, delay_3min, pre_contrast
  example image: images/subj001/delay_3min/WATER__BH_Ax_LAVA_Flex_3min_Series0012.nrrd
  example mask:  masks/subj001/delay_3min/WATER__BH_Ax_LAVA_Flex_10min_Series0017_mask.nrrd

Your own data must use the same folder tree (change IDs / series names):

  DATA/
    images/<subject_id>/<modality>/<one image file>
    masks/<subject_id>/<roi>/<one mask file>

Then load it with the same call the demos use:

  cohort = cohort_from_directory(DATA, modalities=("LAP",), roi="LAP")

Swap DATA / modalities / roi to match your tree. Mask key is often the
same as one image series (here LAP).
Case 1 – three habitats vs four
Four habitats cannot pair one-to-one with three. The one that straddles
several reference habitats (row marked “new”) loses: every reference
habitat has a better partner. It is renamed to id 4, so no two habitats
merge; the other three take the k = 3 ids.
map_k3 = fit_map(enhancement, k=3)
map_k4 = fit_map(enhancement, k=4)
fig = plot_label_overlap_matrix(
    map_k3, map_k4, normalize=True, reference_name="k=3", moving_name="k=4"
)
fig.savefig("out/overlap_k3_vs_k4.png", dpi=150, bbox_inches="tight")
plt.show()

# force=True: align even if both maps carry the same model_id (maps with one
# model_id are otherwise returned unchanged; see the label-switching page).
aligned_k4 = align_habitat_map(map_k3, map_k4, force=True)
print("k=4 ids after matching:", aligned_k4.habitat_ids)
k=4 ids after matching: (1, 2, 3, 4)
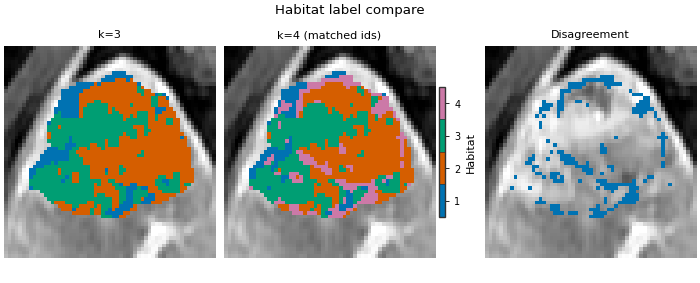
The matched k = 4 map keeps the k = 3 colours for the three
paired habitats; the extra one is the tissue k = 4 split off.
fig = plot_habitat_label_compare(
    image,
    map_k3,
    aligned_k4,
    titles=("k=3", "k=4 (matched ids)"),
    align_labels=False,
    crop_to="labels",
)
fig.savefig("out/overlap_k3_vs_k4_maps.png", dpi=150, bbox_inches="tight")
plt.show()
F:\work\habit_project\habit\viz\habitat_core.py:948: UserWarning: Display geometry conflict: image/anatomy direction does not match mask/label direction. Using the mask/label direction so coronal/sagittal superior-up follows the labelled anatomy. Pass direction= to override.
  resolved_direction, resolved_spacing = resolve_display_geometry(
Case 2 – raw signal vs relative enhancement
One model’s centroids are in signal units, the other’s are ratios, so centroid distance between them means nothing. The overlap table does not care: it only counts voxels.
map_raw = fit_map(raw_signal, k=3)
fig = plot_label_overlap_matrix(
    map_k3,
    map_raw,
    normalize=True,
    reference_name="relative enhancement",
    moving_name="raw signal",
)
fig.savefig("out/overlap_features.png", dpi=150, bbox_inches="tight")
plt.show()

feature_dice = habitat_stability(map_k3, [map_raw])
print(feature_dice.to_string(index=False))
perturbation  habitat_id  matched_id     dice  n_reference  n_matched
           0           1           1 0.717187         7160       6775
           0           2           2 0.717079        14096      13569
           0           3           3 0.691306        13438      14350
Case 3 – how stable is each habitat over restarts?
Five more seeds, each matched to seed 0 by overlap and scored by Dice.
habitat_stability takes the unmatched maps and pairs them itself.
restarts = [fit_map(enhancement, k=3, seed=seed) for seed in range(1, 6)]
stability = habitat_stability(map_k3, restarts)
summary = stability.groupby("habitat_id")["dice"].agg(["mean", "min"]).round(3)
print(summary)
summary
             mean    min
habitat_id
1           0.994  0.990
2           0.994  0.990
3           0.991  0.986
Dice per habitat and restart. A habitat with low Dice is not a stable
region of this tumour at this k.
table = stability.pivot(index="perturbation", columns="habitat_id", values="dice")
fig, ax = plt.subplots(figsize=(4.2, 3.0))
for habitat_id in table.columns:
    ax.plot(table.index + 1, table[habitat_id], marker="o", label=f"H{habitat_id}")
ax.set_xlabel("restart (seed)")
ax.set_ylabel("Dice vs seed 0 (matched ids)")
ax.set_ylim(0.0, 1.02)
ax.set_xticks(table.index + 1)
ax.legend(frameon=False)
ax.set_title("Habitat stability over k-means restarts")
fig.tight_layout()
fig.savefig("out/overlap_restart_dice.png", dpi=150, bbox_inches="tight")
plt.show()
Total running time of the script: (0 minutes 6.761 seconds)