Note
Go to the end to download the full example code.
Quickstart: YAML
Background. A YAML file is a plain-text way to write the same stage list you would build in Python, so an analysis can be run from the shell, shared, and kept next to the results.
Purpose. You get the two-step habitat maps and a volume-fraction / MSI / ITH / graph table from a YAML file, plus one habitat overlay.
Key terms.
YAML config – a text file whose
spec:block is aHabitatSpec(name,random_seed,stages), and whosedata:/output:blocks say where to read subjects and write results.Stage / Spec / HabitatSpec – see Quickstart: Python API; each YAML stage entry is one
Stage, and itscomponentis theSpec.
The same analysis as Quickstart: Python API, written as a YAML
file: same stages, same seed, fitted on the same four subjects. It gives
the same habitat maps and feature values as the Python page, and as
habit get-habitat with config/habitat/config_habitat_quickstart_v1.yaml
on Quickstart: run the demo (YAML + CLI). habit get-habitat --config <file> runs
a file like this from the shell; habit.recipes.run_from_yaml() is the
Python call behind that command. The spec.stages list is the stage
list of the Python page, one entry per stage.
Change DATA to your preprocessed root, SUBJECTS to your subject
folders, and MODALITIES / ROI to your series names. Two details
of the YAML loader:
data.sourceis either a folder (every subject under it) or a manifest YAML that lists subjects and files. The manifest is how the four training subjects are chosen here; the fifth demo subject is the new patient of the Python page.The loader keys the ROI mask by the first modality, so
LAP(the series the tumour was drawn on) is listed first. The Python page listspre_contrastfirst; only the column order differs, the habitat maps do not.
Write the files and run them
The manifest names the four subjects and their LAP masks; the YAML
document names the stages. save=False keeps the result in memory
instead of writing out_dir.
sphinx_gallery_thumbnail_number = 1
from pathlib import Path

import matplotlib.pyplot as plt
import yaml

import habit.recipes as recipes
from habit.contracts import cohort_from_directory
from habit.datasets import fetch_demo
from habit.viz import plot_habitat_overlay

# Change DATA / SUBJECTS / MODALITIES / ROI to your preprocessed layout.
DATA = Path(fetch_demo()).as_posix()
SUBJECTS = ["subj001", "subj002", "subj003", "subj004"]
MODALITIES = ["LAP", "pre_contrast", "PVP", "delay_3min"]  # ROI series first
ROI = "LAP"
Path("out").mkdir(exist_ok=True)

# Manifest: one image folder per subject and modality, one ROI mask folder
# per subject. auto_select_first_file picks the single file in each folder.
manifest_path = Path("out/quickstart_subjects.yaml")
manifest = {
    "auto_select_first_file": True,
    "images": {s: {m: f"{DATA}/images/{s}/{m}" for m in MODALITIES} for s in SUBJECTS},
    "masks": {s: {ROI: f"{DATA}/masks/{s}/{ROI}"} for s in SUBJECTS},
}
manifest_path.write_text(yaml.safe_dump(manifest, sort_keys=False), encoding="utf-8")

yaml_path = Path("out/quickstart.yaml")
yaml_path.write_text(
    f"""\
version: '1.0'
workflow: habitat
mode: train
spec:
  name: quickstart_two_step
  random_seed: 0
  stages:
    - name: extract
      component: {{name: raw, params: {{modalities: [{", ".join(MODALITIES)}], roi: {ROI}}}}}
    - name: partition
      component: {{name: kmeans, params: {{n_supervoxels: 30}}}}
    - name: pool
      component: {{name: pool}}
    - name: fit
      component: {{name: kmeans, params: {{min_habitats: 2, max_habitats: 10, validation: elbow, n_init: 10}}}}
    - name: assign
      component: {{name: nearest_centroid}}
    - name: volume
      component: {{name: volume}}
    - name: msi
      component: {{name: msi}}
    - name: ith
      component: {{name: ith_score}}
    - name: graph
      component: {{name: graph, params: {{include_extended_metrics: false}}}}
data:
  source: {manifest_path.as_posix()}
output:
  out_dir: out/quickstart_yaml
""",
    encoding="utf-8",
)
print(yaml_path.read_text(encoding="utf-8"))

# run_from_yaml parses the file into a HabitatSpec plus a cohort and runs
# it -- the same call ``habit get-habitat`` makes.
result = recipes.run_from_yaml(yaml_path, workflow="habitat", save=False)
print(result.habitat_model.summary())
# The same columns the Python page prints; the values match that table.
table = result.features.frame.set_index("subject")
columns = [c for c in table.columns if c.endswith("_volume_fraction")] + ["ith_score", "contrast", "graph_num_nodes_total"]
print(table[columns].round(3).to_string())
HABIT demo data (cached)
DATA (preprocessed root): C:\Users\dongm\.habit_data\demo-data-v1\preprocessed

On-disk inventory of this folder:
  subjects (5): subj001, subj002, subj003, subj004, subj005
  image series: LAP, PVP, delay_3min, pre_contrast
  mask keys:    LAP, PVP, delay_3min, pre_contrast
  example image: images/subj001/delay_3min/WATER__BH_Ax_LAVA_Flex_3min_Series0012.nrrd
  example mask:  masks/subj001/delay_3min/WATER__BH_Ax_LAVA_Flex_10min_Series0017_mask.nrrd

Your own data must use the same folder tree (change IDs / series names):

  DATA/
    images/<subject_id>/<modality>/<one image file>
    masks/<subject_id>/<roi>/<one mask file>

Then load it with the same call the demos use:

  cohort = cohort_from_directory(DATA, modalities=("LAP",), roi="LAP")

Swap DATA / modalities / roi to match your tree. Mask key is often the
same as one image series (here LAP).
version: '1.0'
workflow: habitat
mode: train
spec:
  name: quickstart_two_step
  random_seed: 0
  stages:
    - name: extract
      component: {name: raw, params: {modalities: [LAP, pre_contrast, PVP, delay_3min], roi: LAP}}
    - name: partition
      component: {name: kmeans, params: {n_supervoxels: 30}}
    - name: pool
      component: {name: pool}
    - name: fit
      component: {name: kmeans, params: {min_habitats: 2, max_habitats: 10, validation: elbow, n_init: 10}}
    - name: assign
      component: {name: nearest_centroid}
    - name: volume
      component: {name: volume}
    - name: msi
      component: {name: msi}
    - name: ith
      component: {name: ith_score}
    - name: graph
      component: {name: graph, params: {include_extended_metrics: false}}
data:
  source: out/quickstart_subjects.yaml
output:
  out_dir: out/quickstart_yaml

Checkpoint fingerprint mismatch under out\quickstart_yaml\.habitat_checkpoint: stored='2efc96a8f587fa8e7eb3ad17ffbebede21694e7c08b55c872d4526f331e91160', current='1e2b8eee427137d5dc23169dc59cefef9c2fd1edf001edb3b80785edf3cfbec2'. Cannot resume with strict_checkpoint_hash=True. Incompatible entries remain on disk but are unreachable via fingerprint-scoped cache keys.

Cohort.map[_ComputeUnits]:   0%|          | 0/4 [00:00<?, ?it/s]
Cohort.map[_ComputeUnits]:  25%|██▌       | 1/4 [00:00<00:00, 10.18it/s]
Cohort.map[_ComputeUnits]:  50%|█████     | 2/4 [00:00<00:00, 11.00it/s]
Cohort.map[_ComputeUnits]:  75%|███████▌  | 3/4 [00:00<00:00, 11.24it/s]
Cohort.map[_ComputeUnits]: 100%|██████████| 4/4 [00:00<00:00, 11.23it/s]
Cohort.map[_ComputeUnits]: 100%|██████████| 4/4 [00:00<00:00, 11.23it/s]

Cohort.map[_AssignPrecomputedUnits]:   0%|          | 0/4 [00:00<?, ?it/s]
Cohort.map[_AssignPrecomputedUnits]:  25%|██▌       | 1/4 [00:00<00:00,  6.15it/s]
Cohort.map[_AssignPrecomputedUnits]:  50%|█████     | 2/4 [00:00<00:00,  6.11it/s]
Cohort.map[_AssignPrecomputedUnits]:  75%|███████▌  | 3/4 [00:00<00:00,  5.96it/s]
Cohort.map[_AssignPrecomputedUnits]: 100%|██████████| 4/4 [00:00<00:00,  6.10it/s]
Cohort.map[_AssignPrecomputedUnits]: 100%|██████████| 4/4 [00:00<00:00,  6.09it/s]
HabitatModel kmeans-b01ecfd00139f26e
  habitats           : 5
  features (4)    : LAP, pre_contrast, PVP, delay_3min
  defining cohort    : n=4
  modalities         : LAP, pre_contrast, PVP, delay_3min
  cohort digest      : 81dc6515a9f2b393...
  produced by        : habitat_model_fitter.kmeans
  habit version      : 3.0.0
  random seed        : 0
  preprocessing state: inertia, selection_report, validation
         habitat_1_volume_fraction  habitat_2_volume_fraction  habitat_3_volume_fraction  habitat_4_volume_fraction  habitat_5_volume_fraction  ith_score  contrast  graph_num_nodes_total
subject
subj001                      0.090                      0.110                      0.182                      0.182                      0.436      0.949     1.424                  498.0
subj002                      0.000                      0.171                      0.196                      0.117                      0.516      0.850     2.295                  125.0
subj003                      0.000                      0.424                      0.000                      0.576                      0.000      0.796     1.639                   47.0
subj004                      0.178                      0.169                      0.550                      0.000                      0.104      0.862     1.461                  105.0
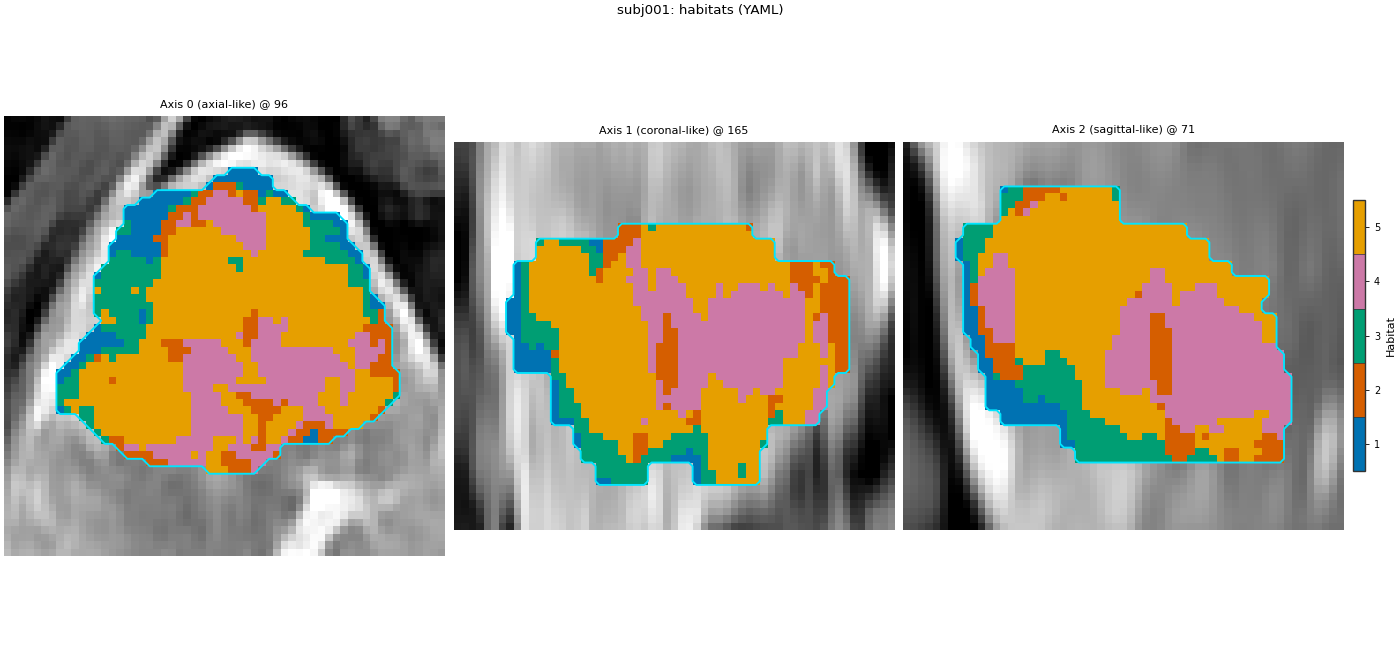
Look at one habitat map
The anatomy comes from the same folder the YAML named. The saved model
(save=True writes it under out_dir) labels a new patient the
way the Python page shows in its last section.
habitat_map = result.habitat_maps[0]
cohort = cohort_from_directory(DATA, modalities=(ROI,), roi=ROI)
subject = next(s for s in cohort if s.subject_id == habitat_map.subject_id)
fig = plot_habitat_overlay(
    subject.image(ROI),
    habitat_map,
    title=f"{subject.subject_id}: habitats (YAML)",
    crop_to="labels",
)
fig.savefig("out/quickstart_yaml_overlay.png", dpi=150, bbox_inches="tight")
plt.show()
F:\work\habit_project\habit\viz\habitat_overlay.py:806: UserWarning: Display geometry conflict: image/anatomy direction does not match mask/label direction. Using the mask/label direction so coronal/sagittal superior-up follows the labelled anatomy. Pass direction= to override.
  resolved_direction, resolved_spacing = resolve_display_geometry(
Total running time of the script: (0 minutes 2.122 seconds)