3. Habitat Quantification
Background. A habitat map is a picture; statistics and prediction models need numbers. Purpose. Each page turns one subject’s habitat map into a row of features (sizes, spatial mixing, fragmentation, network shape, radiomics, embeddings) that you can join to outcomes downstream.
These metrics are the quantify stages of the complete analysis (volume, MSI, ITH, graph). Each page refits a small cohort so it can be copied on its own, then computes one family from the label map.
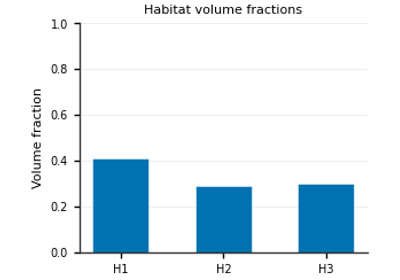
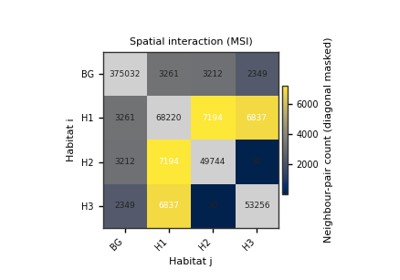
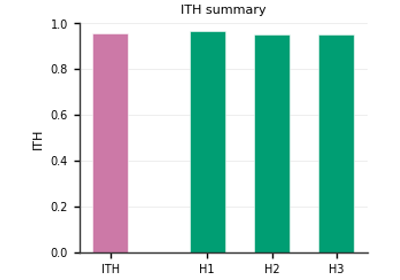
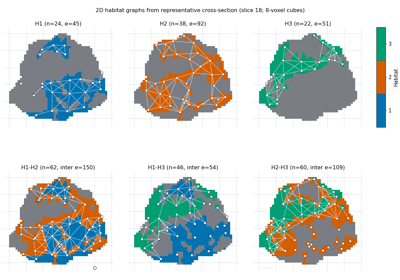
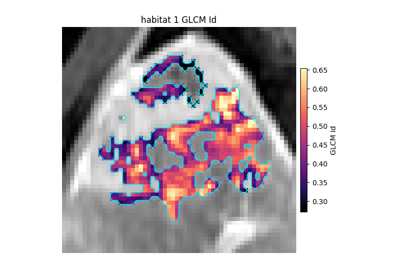
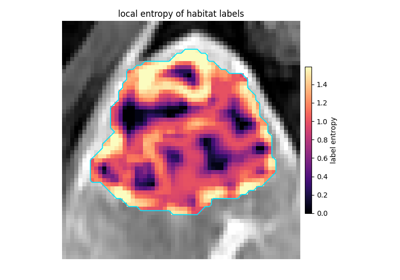
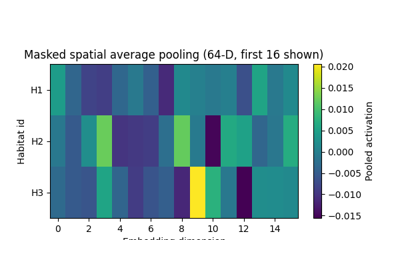
Quantify habitats with atomic functions: volume and fractions, multiregional spatial interaction (MSI, Wu et al. 2018), intratumoral heterogeneity (ITH), graph topology networks, per-habitat radiomics, whole-habitat radiomics, and deep-learning masked embeddings.