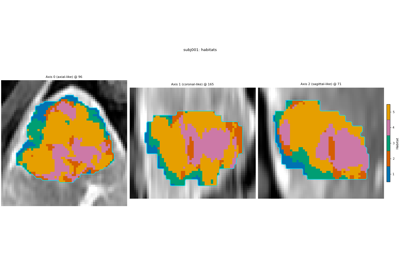
plot_habitat_overlay
Note
This page is a reference documentation. It only explains the function signature, and not how to use it. Please refer to the Habitat Guide and Python API guide (v2.0) for usage.
- plot_habitat_overlay(image: object, labels: object, *, alpha: float = 1.0, title: str | None = None, axis: int | None = None, index: int | Sequence[int] | None = None, direction: Sequence[float] | None = None, spacing: Sequence[float] | None = None, display_convention: DisplayConvention = 'radiological', contour: bool = True, colorbar: ColorbarSpec = True, colorbar_label: str = 'Habitat', crop_to: str = 'none', crop_pad: int = 6, crop_labels: object | None = None) Figure[source]
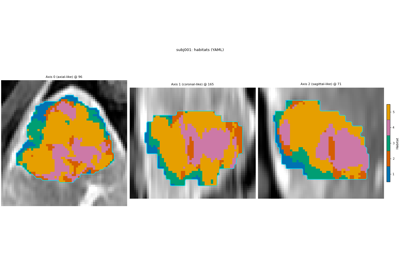
Draw habitat labels as an opaque colour overlay on the source image.
For 3D volumes the default is a three-panel figure (orthogonal slices in NumPy axis order
0 / 1 / 2, i.e. SimpleITK(z, y, x)). Each panel uses the slice with the most non-background habitat voxels so the overlay is visible even when the tumour is off-centre. Passaxisplus an integerindexto pin one plane, or passindexas three original-volume indices (axis 0, 1, 2) to pin the triptych. Label0is treated as background and is not coloured.Two maps of the same tumour are comparable only when they share this window. Pass the same
indexand the samecrop_labels(the union of both label maps) withcrop_to="labels". Each call would otherwise zoom to its own habitat bounding box and pick its own densest slices.Slices are oriented using
direction(SimpleITK flattened 3x3) anddisplay_convention(default"radiological"). Whendirectionis omitted, HABIT reads it from anImageVolume/HabitatMapif you pass those objects rather than bare arrays; otherwise LPS identity is assumed — the same default asImageVolume— not RAS.Panel aspect ratios follow
spacing(SimpleITK(x, y, z)) so thick slices are not squashed into square pixels on coronal / sagittal views. Pass the volume object (not.data) so coronal/sagittal superior-up and left-right match ITK-SNAP / 3D Slicer. Override withdisplay_convention="native"to skip display flips, or"neurological"for patient-left on the viewer’s left.- Parameters:
image – Source image array (2D or 3D; SimpleITK/NumPy
(z, y, x)order) or anImageVolume.labels – Habitat label map with the same shape as
image, or aHabitatMap.alpha – Habitat colour opacity (default
1.0= opaque inside habitat voxels; anatomy stays grey outside). Use(0, 1)only for an explicit translucent blend.contour – When True, outline non-background habitat voxels.
title – Optional figure title (ASCII-sanitised).
axis – If set, draw only this axis (
0,1, or2).index – Original-volume slice index. With
axisset, one integer (or omitted, for the densest slice on that axis). For the default triptych, a sequence of three integers, one per axis, or omitted so each panel picks its own densest slice. Indices count from the volume you passed, including whencrop_to="labels"zooms the frame.direction – Optional SimpleITK direction cosines (9 floats). Same layout as
ImageVolume.direction. Controls anterior/posterior, superior/inferior, and left/right flips per panel. Inferred fromimage/labelswhen omitted.spacing – Optional SimpleITK voxel spacing
(x, y[, z])in mm. Same layout asImageVolume.spacing. Controls true physical aspect per panel; inferred from the volume object, else isotropic1.0.display_convention –
"radiological"(default),"neurological", or"native"(no display flips). Seehabit.viz.orientation.colorbar – Draw a discrete habitat-ID colorbar (default
True). One tick / colour per positive ID; background0is omitted. PassFalseto hide it, or a mapping of colorbar style kwargs (shrink,pad,fraction,aspect,label, …).colorbar_label – Colorbar label (English default
"Habitat").crop_to –
"none"(default) draws the full field of view;"labels"zooms every panel to the bounding box of non-background habitat voxels so a small tumour fills the frame. Display-only zoom: values, spacing and orientation are unchanged.crop_pad – Voxels of anatomical context kept around the bounding box when
crop_to="labels"(default6).crop_labels – Optional label volume used only to place the
crop_to="labels"window. Same shape asimage. When omitted, the window is the bounding box oflabels. Pass the union of every map being compared so each figure uses that same window. Required together withcrop_to="labels"; passing it with anothercrop_toraises.
- Returns:
A matplotlib
Figure. The caller owns persistence / display.- Raises:
HABITAPIError – On shape / parameter errors.
OptionalDependencyError – When matplotlib is not installed.
See also
habit.contracts.HabitatMapLabel image this function overlays.