plot_habitat_graph_network_2d
Note
This page is a reference documentation. It only explains the function signature, and not how to use it. Please refer to the Habitat Guide and Python API guide (v2.0) for usage.
- plot_habitat_graph_network_2d(label_array: np.ndarray, *, options: HabitatGraphFeatureOptions | None = None, slice_index: int | None = None, show_background: bool = True, show_grid: bool = True, block_size: int | None = None, grid_linestyle: str = '--', grid_color: str = '#6B7280', grid_alpha: float = 0.45, grid_linewidth: float = 0.55, panel_size: float = 3.2, max_cols: int = 4, node_size: float = 28.0, colorbar: ColorbarSpec = True, colorbar_label: str = 'Habitat', **kwargs: Any) 'Figure' | None[source]
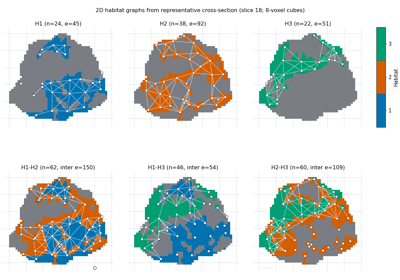
Draw the intra/inter habitat graphs built from the 2D slice habitat map.
Node extraction and edge construction reuse the same configured algorithms as the feature extractor, but the input is the representative cross-section rather than the full 3D volume. Display knobs override
optionsfor drawing only (extraction still usesoptions).Graph-construction fields may be passed as flat
**kwargs(same names asHabitatGraphFeatureOptions), so callers do not need a separate options object:plot_habitat_graph_network_2d(labels, block_size=8, show_grid=True)
Each H1–Hk panel fills only that habitat in its palette colour and overlays white intra-edges plus white nodes (solid dots, thin dark outline). Other habitats use one mid-dark gray wash for shape context (not a light fill that hides white strokes). Each unordered habitat pair gets its own panel: those two habitats stay in palette colours, other habitats use the same gray wash, and only white inter-edges between that pair are drawn (no intra-edges, no edges to other habitats, no purple). H1–H4 sit on the first row when
K <= 4; six pairs (K=4) use a 2x3 placement in an equal-cell parent grid so every panel is the same physical size. All panels share one spatial window (union of every habitat on the slice plus a shared pad), the same solid-dot node size, and the same edge linewidth.- Parameters:
label_array – 2D or 3D habitat label map (background encoded as 0).
options – Graph construction options shared with the feature extractor.
None(default) builds defaults, optionally fromkwargs.slice_index – Explicit axis-0 slice for 3D input;
Noneselects the largest cross-section. Ignored for 2D input.show_background – Whether to draw habitat partitions behind the graph (default
True). Featured habitats (one on an H panel, two on a pair panel) are full colour; other foreground is a mid-dark gray wash; background 0 stays undrawn. Graph nodes and edges are white.show_grid – Draw the uniform-grid lattice (default
True). Also draws whenblock_sizeis passed incomponentmode.block_size – Display cube edge in voxels.
None(default) usesoptions.block_size(library default 8 voxels) so the lattice matches the nodes.grid_linestyle – Matplotlib line style (default
"--"dashed).grid_color – Lattice colour.
grid_alpha – Lattice opacity.
grid_linewidth – Lattice stroke width in points.
panel_size – Base panel edge length in inches.
max_cols – Maximum number of H-panel columns (H1–H4 on the first row when
K <= 4). Six pair panels use a 2x3 placement inside an equal-cell parent grid.node_size – Matplotlib scatter area in points squared applied to every panel (default
28). H1–Hk and pairwise panels share this size. Voxel count does not scale markers.colorbar – Discrete habitat-ID colorbar in a reserved column so it does not shrink any H or pair panel (default
True). PassFalseto hide it.colorbar_label – Colorbar label (English default
"Habitat").**kwargs – Optional field overrides for
HabitatGraphFeatureOptions(merged intooptionsas described above).
- Returns:
The matplotlib
Figure, orNonewhen the slice holds no habitat nodes to draw.- Raises:
OptionalDependencyError – When matplotlib is not installed.