plot_habitat_graph_slice
Note
This page is a reference documentation. It only explains the function signature, and not how to use it. Please refer to the Habitat Guide and Python API guide (v2.0) for usage.
- plot_habitat_graph_slice(label_array: np.ndarray, *, options: HabitatGraphFeatureOptions | None = None, slice_index: int | None = None, show_grid: bool = True, block_size: int | None = None, grid_linestyle: str = '--', grid_color: str = '#6B7280', grid_alpha: float = 0.45, grid_linewidth: float = 0.55, panel_size: float = 3.2, colorbar: ColorbarSpec = True, colorbar_label: str = 'Habitat', **kwargs: Any) Figure[source]
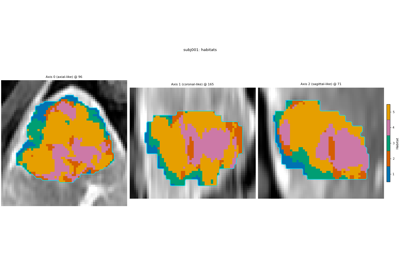
Draw the colored habitat map at the largest cross-section (2D).
Display knobs (
show_grid,block_size,grid_linestyle, …) overrideoptionsfor drawing only. Node extraction still usesoptions. Default lattice:block_size=None→options.block_size(library default 8 voxels), dashed lines.Graph-construction fields may be passed as flat
**kwargs(same names asHabitatGraphFeatureOptions), so callers do not need a separate options object:plot_habitat_graph_slice(labels, block_size=8, show_grid=True)
- Parameters:
label_array – 2D or 3D habitat label map (background encoded as 0).
options – Graph construction options shared with the extractor.
None(default) builds defaults, optionally fromkwargs.slice_index – Explicit axis-0 slice for 3D input;
Noneselects the largest cross-section. Ignored for 2D input.show_grid – Draw the node lattice (default
True).block_size – Display cube edge in voxels.
None(default) usesoptions.block_sizeso the lattice matches the nodes.grid_linestyle – Matplotlib line style (default
"--"dashed).grid_color – Lattice colour.
grid_alpha – Lattice opacity.
grid_linewidth – Lattice stroke width in points.
panel_size – Base panel edge length in inches.
colorbar – Discrete habitat-ID colorbar (default
True). Background0is omitted from the bar. PassFalseto hide it.colorbar_label – Colorbar label (English default
"Habitat").**kwargs – Optional field overrides for
HabitatGraphFeatureOptions(merged intooptionsas described above).
- Returns:
The matplotlib
Figure; the caller decides where it goes.- Raises:
OptionalDependencyError – When matplotlib is not installed.