plot_prototype_matching
Note
This page is a reference documentation. It only explains the function signature, and not how to use it. Please refer to the Habitat Guide and Python API guide (v2.0) for usage.
- plot_prototype_matching(blocks: Sequence[Any], match: Any, *, block_names: Sequence[str] | None = None, feature_names: Sequence[str] | None = None, feature_axes: Tuple[int, int] = (0, 1), show_links: bool = True, title: str | None = None, ax: 'Axes' | None = None) Figure[source]
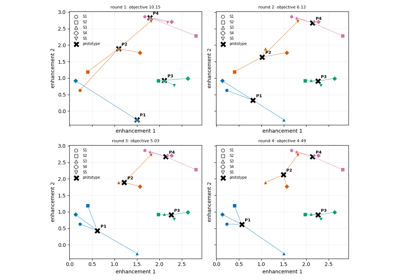
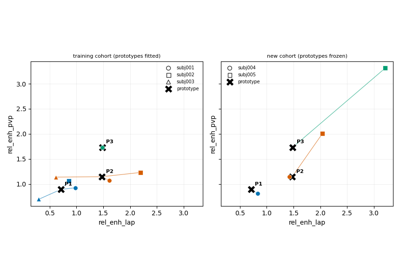
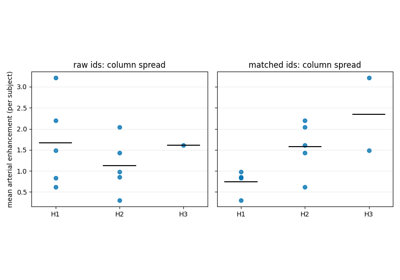
Habitat summaries of every subject, coloured by their shared prototype.
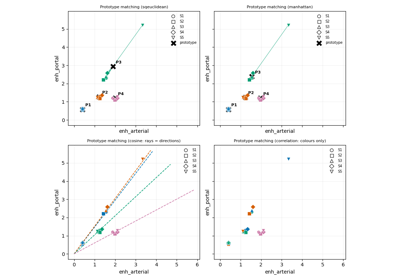
Each point is one habitat of one subject (marker = subject, colour = the prototype it was named after, i.e. the shared habitat id
k + 1). Grey hollow points were left unnamed (max_distanceor more habitats than frozen prototypes). Prototypes are drawn so the reader sees why a habitat got its name:HabitatPrototypeAlignment– the descriptive prototypes (mean or median of the input summaries), as black crosses with links;PrototypeMatchwith"sqeuclidean"/"manhattan"– the fitted prototypes, as crosses with links (pass the same, possibly z-scored, blocks that were matched);"cosine"– prototypes are directions, drawn as rays from the origin: points on one ray are identical to cosine however far apart;"correlation"– prototypes live in row-centred space with no point in this plane, so only the colours are drawn.
- Parameters:
blocks – Per-subject summaries, shape
(n_habitats, n_features), in the order that was matched (e.g.[m.centroids for m in models]).match – Result of
match_rows_to_prototypes()oralign_habitat_maps_to_prototypes().block_names – Legend name per block. Defaults to subject ids for an alignment,
S1, S2, ...otherwise.feature_names – Axis names. Defaults to the alignment’s feature names,
feature 0, feature 1, ...otherwise.feature_axes – The two feature columns to plot (1-feature summaries are drawn against a zero y-axis).
show_links – Draw a line from each habitat to its prototype.
title – Optional axes title.
ax – Optional axes to draw into (returns its figure).
- Returns:
A matplotlib
Figure.- Raises:
HABITAPIError – On malformed blocks, mismatched results, or feature axes out of range.