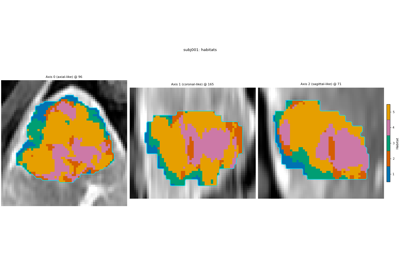
plot_partition_triptych
Note
This page is a reference documentation. It only explains the function signature, and not how to use it. Please refer to the Habitat Guide and Python API guide (v2.0) for usage.
- plot_partition_triptych(image: np.ndarray, supervoxel_labels: np.ndarray, habitat_labels: np.ndarray, *, titles: Tuple[str, str, str] = ('Anatomy', 'Supervoxels', 'Habitats'), alpha: float = 1.0, axis: int = 0, index: int | None = None, direction: Sequence[float] | None = None, spacing: Sequence[float] | None = None, display_convention: DisplayConvention = 'radiological', colorbar: ColorbarSpec = True, colorbar_label: str = 'Habitat') Figure[source]
Two-step partition view: greyscale | supervoxel overlay | habitat overlay.
- Parameters:
image – Anatomy volume.
supervoxel_labels – Integer supervoxel map (0 = background).
habitat_labels – Integer habitat map (0 = background).
titles – Three panel titles.
alpha – Overlay opacity for label panels (default
1.0= opaque).axis – Slice axis for 3D volumes.
index – Slice index; densest habitat slice when omitted.
direction – Optional SimpleITK direction cosines.
spacing – Optional SimpleITK spacing.
display_convention – Display convention for flips.
colorbar – Discrete habitat-ID colorbar on the habitat panel only (default
True). Anatomy and supervoxel panels are not habitat maps. PassFalseto hide it.colorbar_label – Colorbar label (English default
"Habitat").
- Returns:
A matplotlib
Figure.