plot_label_overlap_matrix
Note
This page is a reference documentation. It only explains the function signature, and not how to use it. Please refer to the Habitat Guide and Python API guide (v2.0) for usage.
- plot_label_overlap_matrix(reference: Any, moving: Any, *, mapping: Mapping[int, int] | None = None, normalize: bool = False, reference_name: str = 'reference', moving_name: str = 'moving', title: str | None = None, colorbar: ColorbarSpec = True, ax: 'Axes' | None = None) Figure[source]
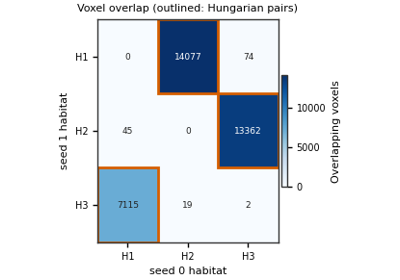
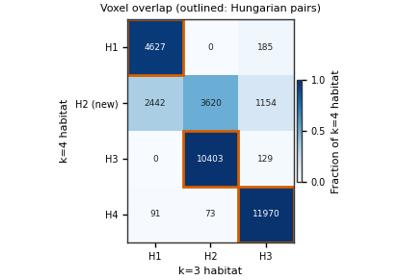
Heatmap of the voxel-overlap table of two label maps of the same voxels.
Cell
(i, j)counts voxels labelled moving habitatiand reference habitatj(overlap_count_table()). The outlined cells are the one-to-one pairs chosen by Hungarian assignment on those counts (match_labels_by_overlap()), i.e. the pairing that keeps the largest total number of voxels. A moving habitat without an outlined cell has no reference partner (the moving map has more habitats) and receives a new id when remapped.- Parameters:
reference – Reference labels:
np.ndarrayorHabitatMap.moving – Moving labels on the same voxel grid.
mapping –
{moving_id: reference_id}to outline.None(default) computes the overlap Hungarian pairing.normalize – If True, colour each row by the fraction of that moving habitat’s labelled voxels (rows sum to at most 1), so small habitats are as readable as large ones. Numbers stay counts.
reference_name – Axis name of the reference map.
moving_name – Axis name of the moving map.
title – Optional axes title.
colorbar –
True/Falseor colorbar style kwargs.ax – Optional axes to draw into (returns its figure).
- Returns:
A matplotlib
Figure.- Raises:
HABITAPIError – If the maps differ in shape or share no labelled voxel.