plot_directory_ingest
Note
This page is a reference documentation. It only explains the function signature, and not how to use it. Please refer to the Habitat Guide and Python API guide (v2.0) for usage.
- plot_directory_ingest(image: object, roi_mask: object, *, tree: Sequence[Tuple[int, str, str]] | None = None, title: str = 'From directory to Subject', panel_title: str = 'Subject anatomy + ROI', crop_pad: int = 8) Figure[source]
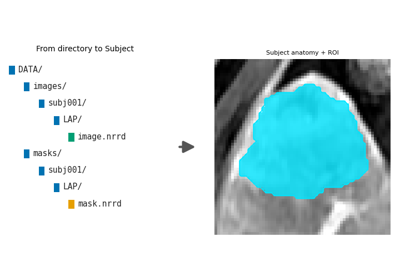
Diagram for the directory-ingestion route: tree -> Subject with ROI.
- Parameters:
image – Anatomy volume (array or
ImageVolume) of one subject.roi_mask – ROI mask (array or
MaskVolume), same grid asimage.tree – Optional
(depth, name, kind)entries overriding the default preprocessed-tree schematic; kind is"folder"/"image"/"mask".title – Figure title (ASCII-sanitised).
panel_title – Title of the cropped data panel.
crop_pad – Context voxels around the ROI bounding box (default
8).
- Returns:
A matplotlib
Figurewith the directory tree on the left and the cropped anatomy + cyan ROI fill on the right.