Preprocessing
Note
Supporting integration, not the habitat core. Guide walk-through: Image preprocessing. Demo pack is already preprocessed — habitat maps: Two-step habitat analysis.
Goal: turn images (or DICOM) into a preprocessed images/ + masks/ tree.
First demo run: skip this page — the demo pack already has
demo_data/preprocessed/. Go to Two-step habitat analysis.
Run
habit check-config --config config/preprocessing/config_preprocessing_demo.yaml
habit preprocess --config config/preprocessing/config_preprocessing_demo.yaml
Faster smoke:
habit preprocess --config config/preprocessing/config_preprocessing_minimal.yaml
DICOM helpers:
habit dicom-info -i demo_data/dicom -o demo_data/results/htg_dicom_info.csv --one-file-per-folder
habit sort-dicom --config config/dicom_sort/config_sort_dicom.yaml
Your data
Edit ★ in a copied YAML: data_dir (folder or path-list YAML), out_dir,
and modality names. Then habit check-config + habit preprocess.
Success: out_dir/processed_images/images/<subject>/<modality>/ has NIfTI.
Anatomy | processed intensity. The figure is written by the image preprocessing gallery (Image preprocessing). Reproduce it:
python docs/source/examples/scripts/image_preprocessing_demo.py
The plot call in that script:
from habit.viz import plot_intensity_slice

fig = plot_intensity_slice(
    processed.image(modality),
    before=subject.image(modality),
    axis=0,
    cmap="gray",
    image_label="Z-scored LAP",
    before_label="Original LAP",
    title="Image preprocess: original | z-scored",
    colorbar_label="Z-score",
    before_colorbar_label="Intensity",
)
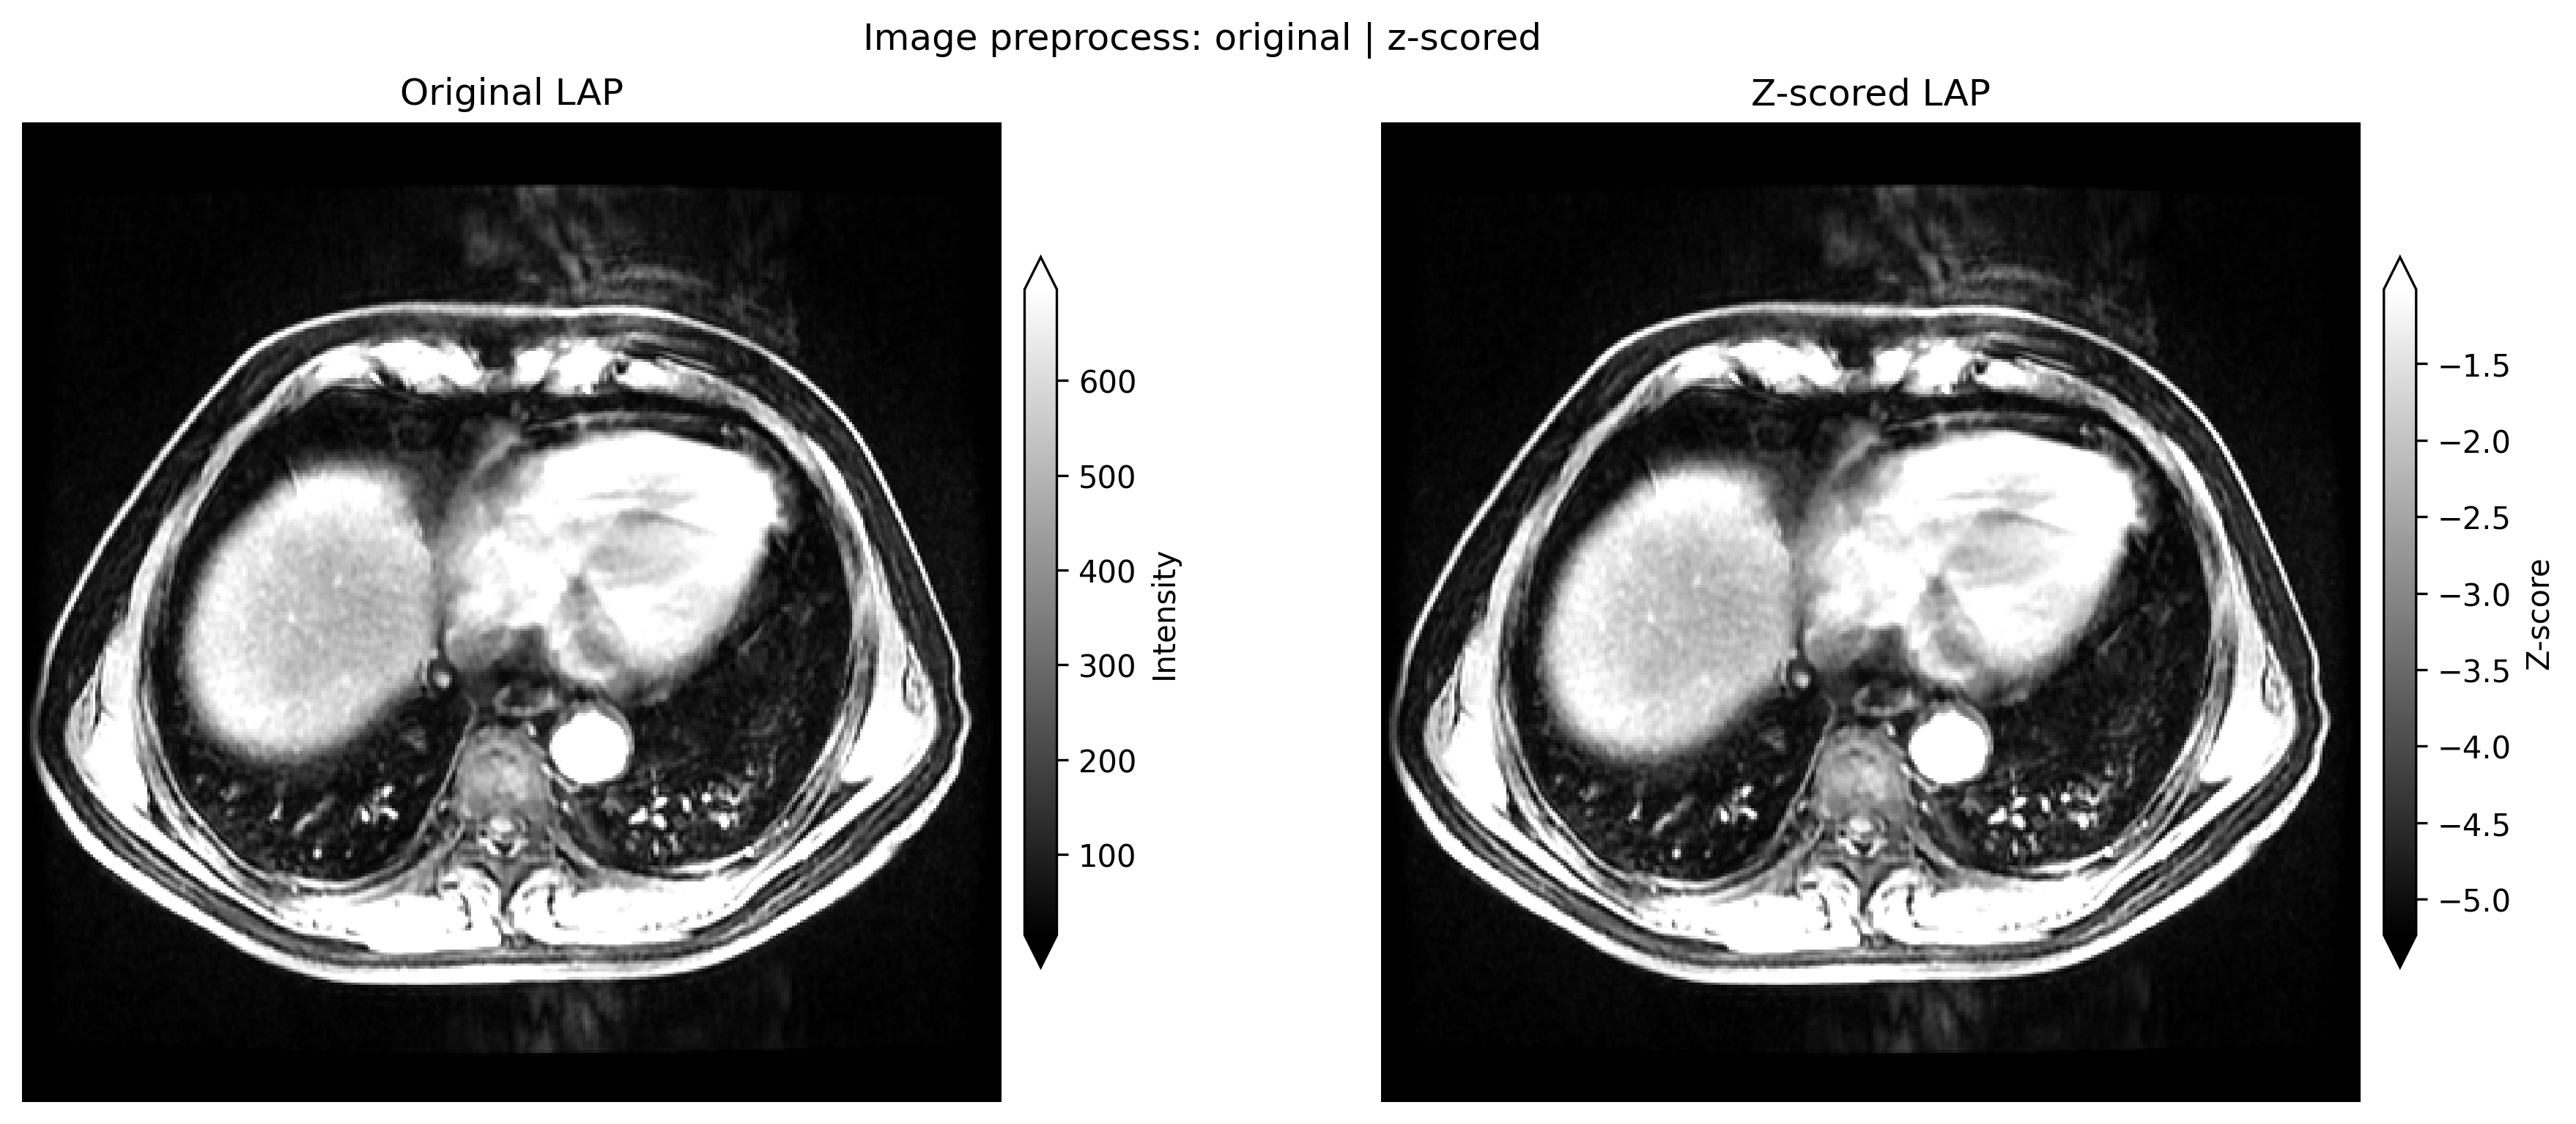
Whole-FOV greyscale z-score panel from subj001 LAP
(demo_data/preprocessed). Independent colorbars show raw intensity
versus z-score (native units; not a shared \([0, 1]\) window).
Image z-score here is per-volume intensity (DICOM/NIfTI tree). It is
not the clustering-time winsorize / minmax chain; skipping that
chain on two-step runs under-expresses habitats — see
Feature preprocessing.
Atomic Python (same steps, no YAML)
preprocess_subject() / preprocess_image() take a
Subject or one volume. Copy from Image preprocessing
and swap DATA. Per-step figures:
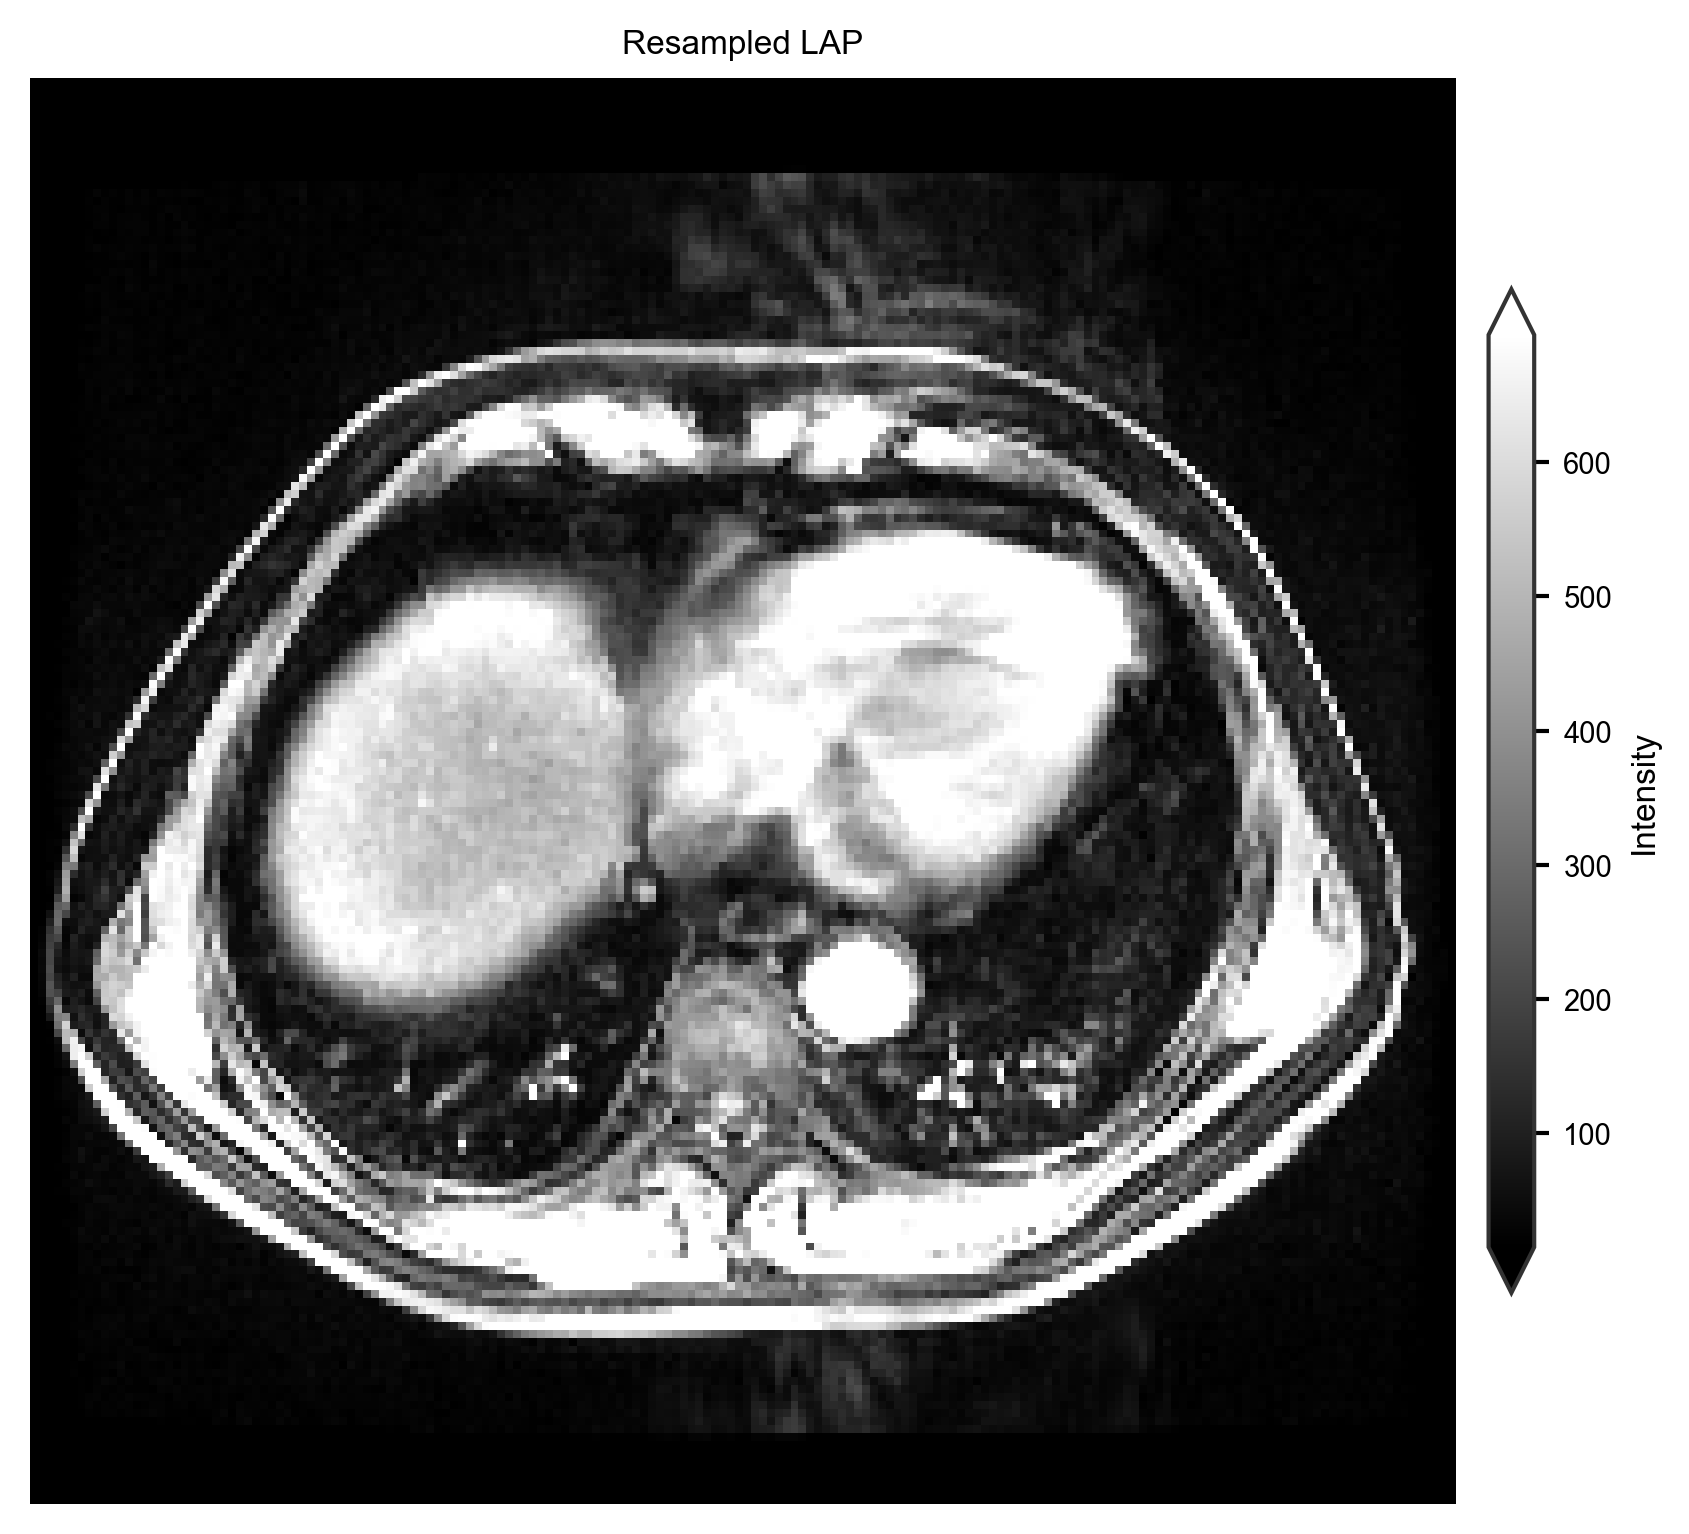
Resample (full FOV, subj001 LAP).
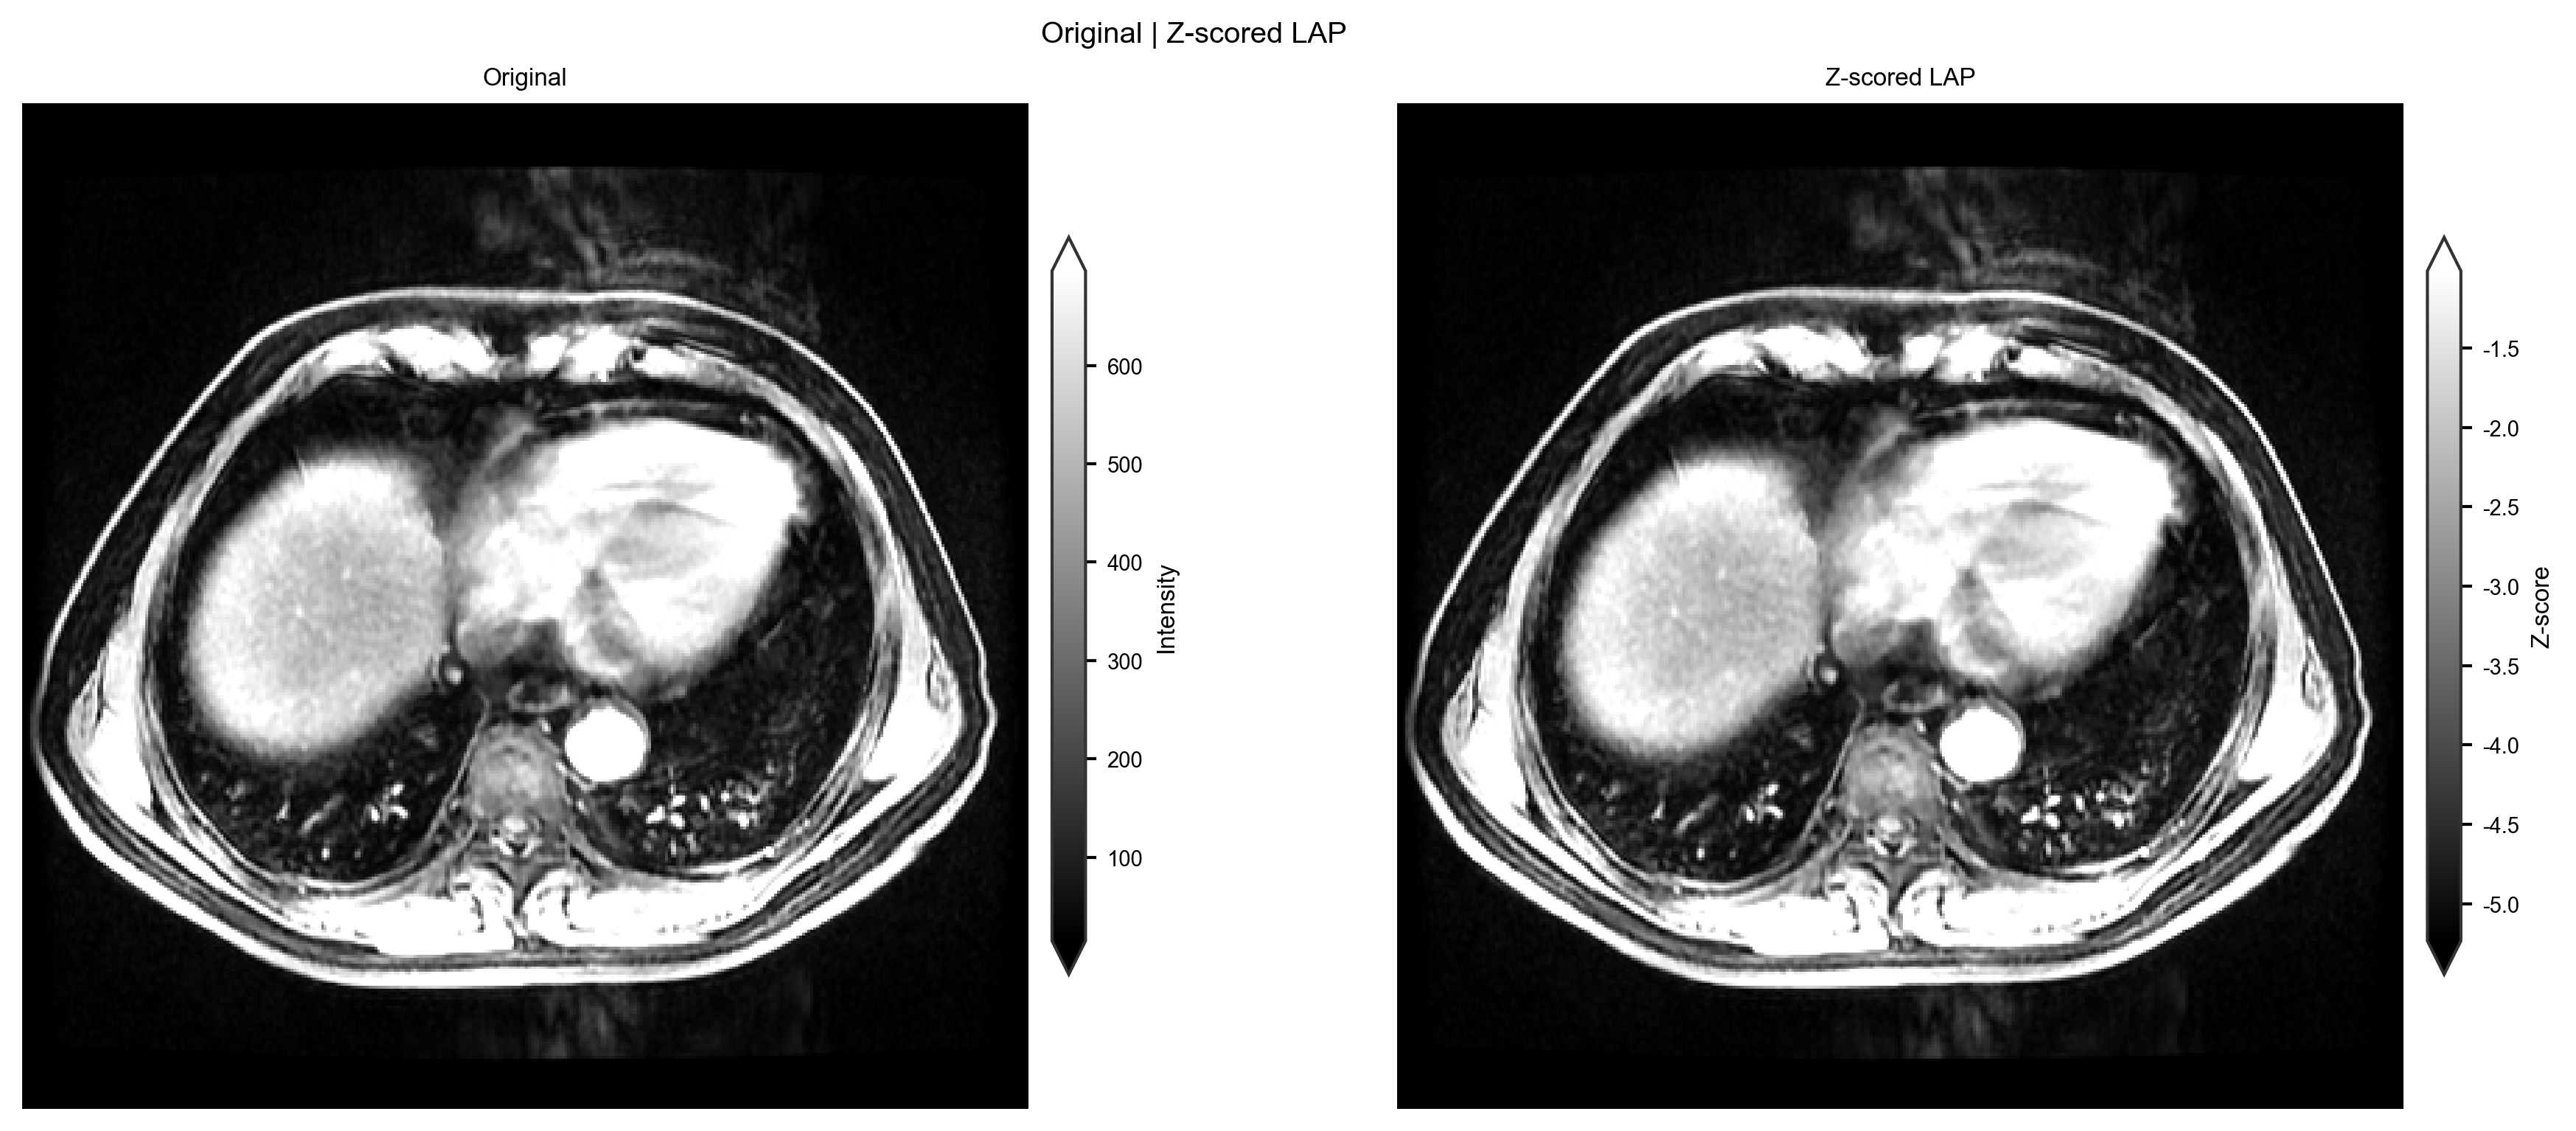
Z-score (whole volume; optional ROI stats). Independent colorbars show raw intensity versus z-score.
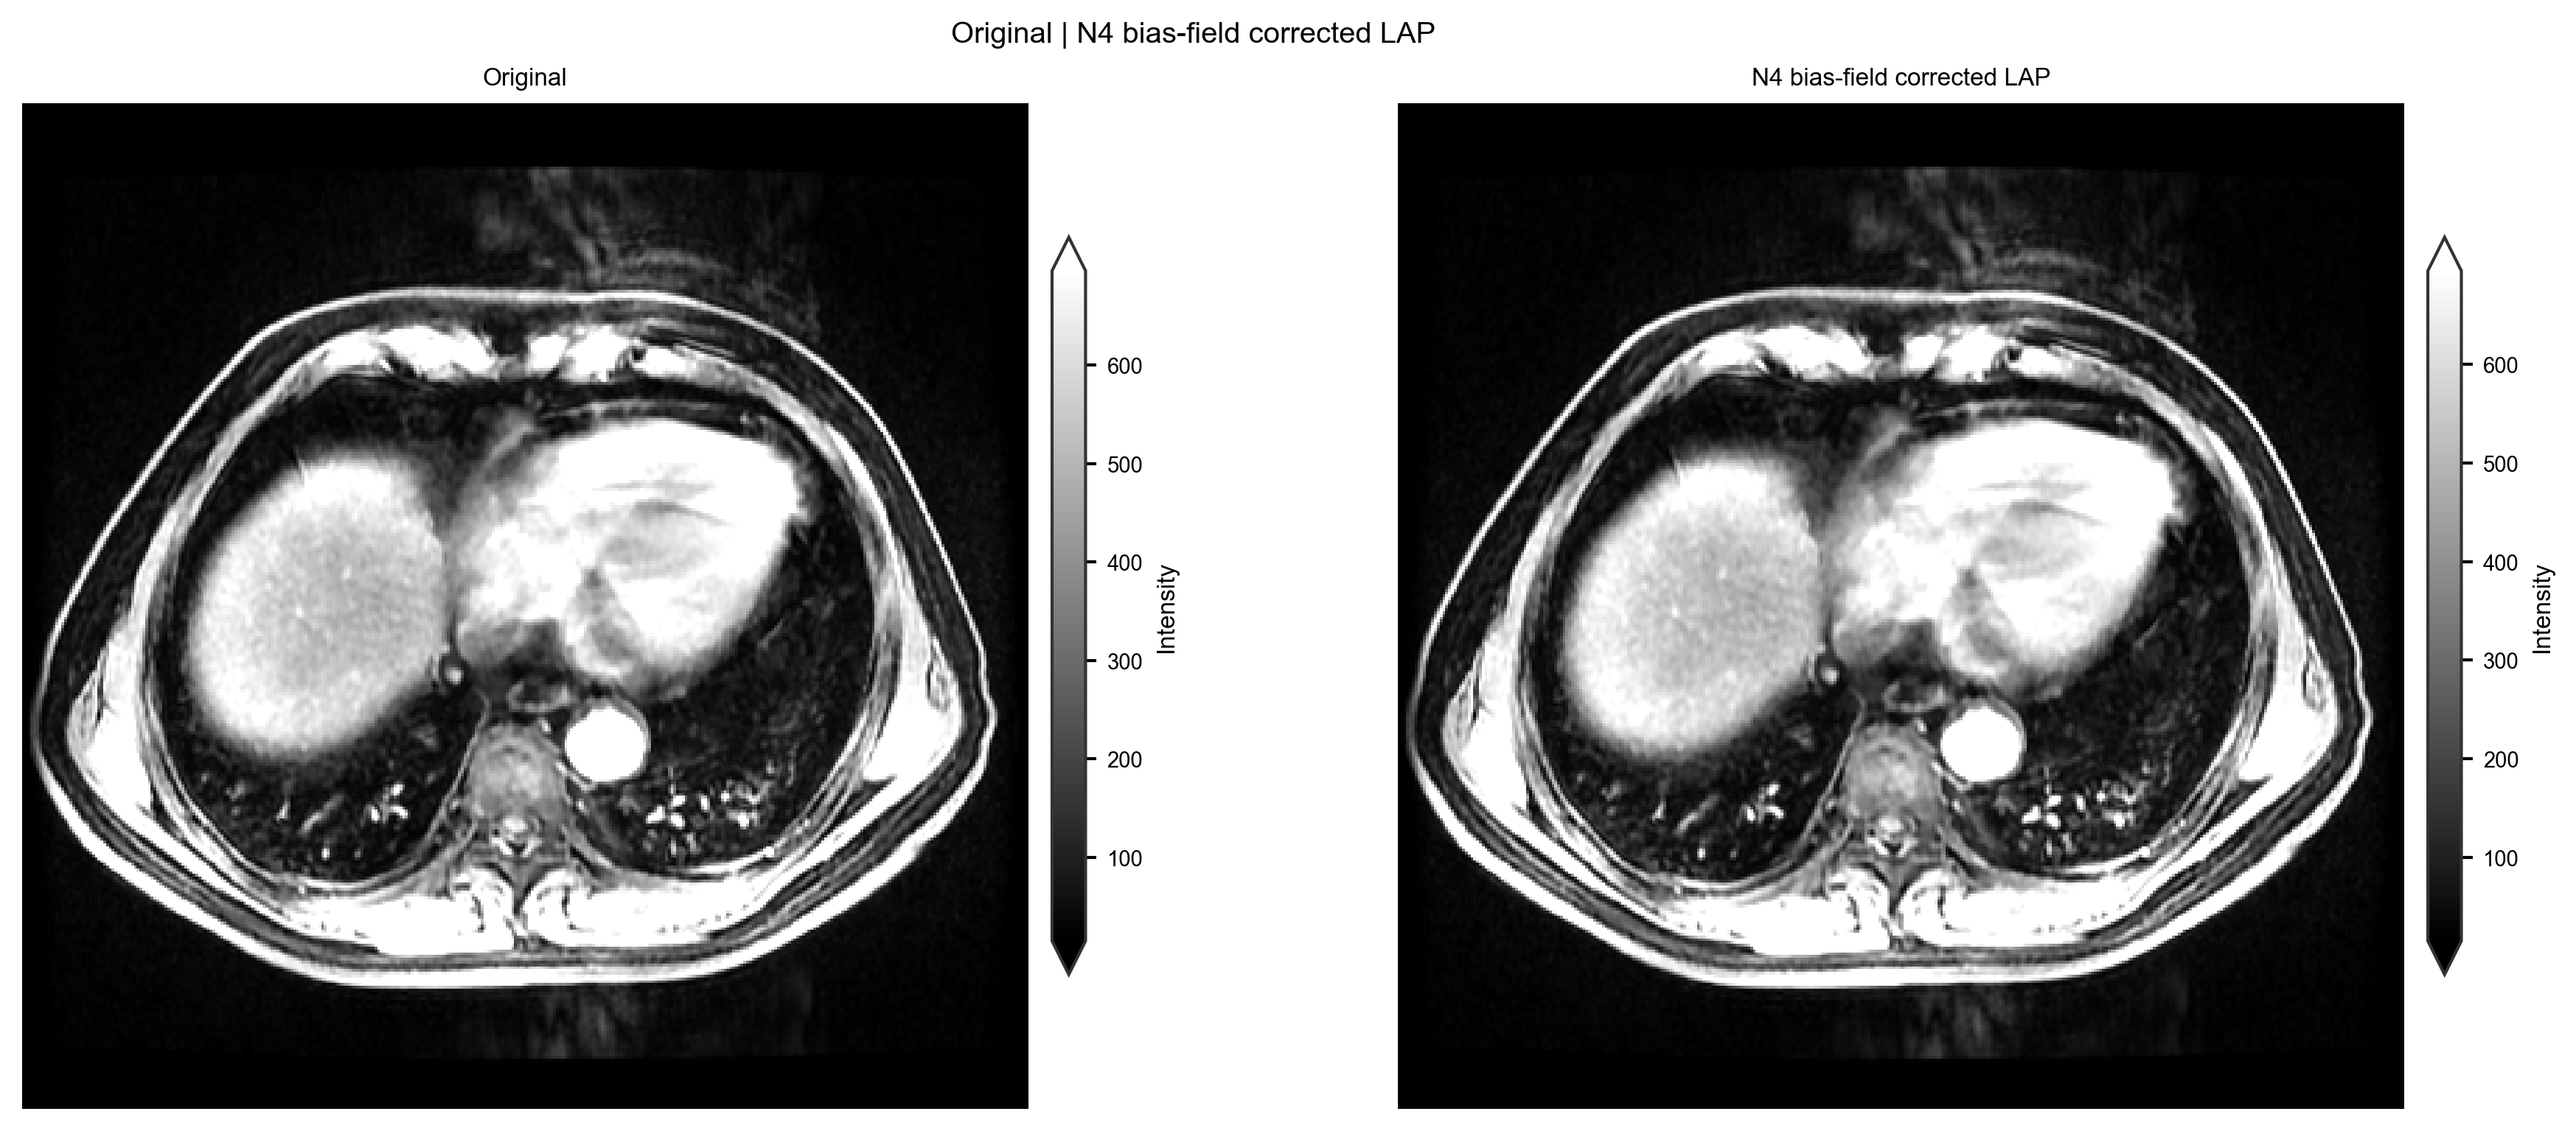
N4 bias-field correction. Independent colorbars keep the intensity scale visible.
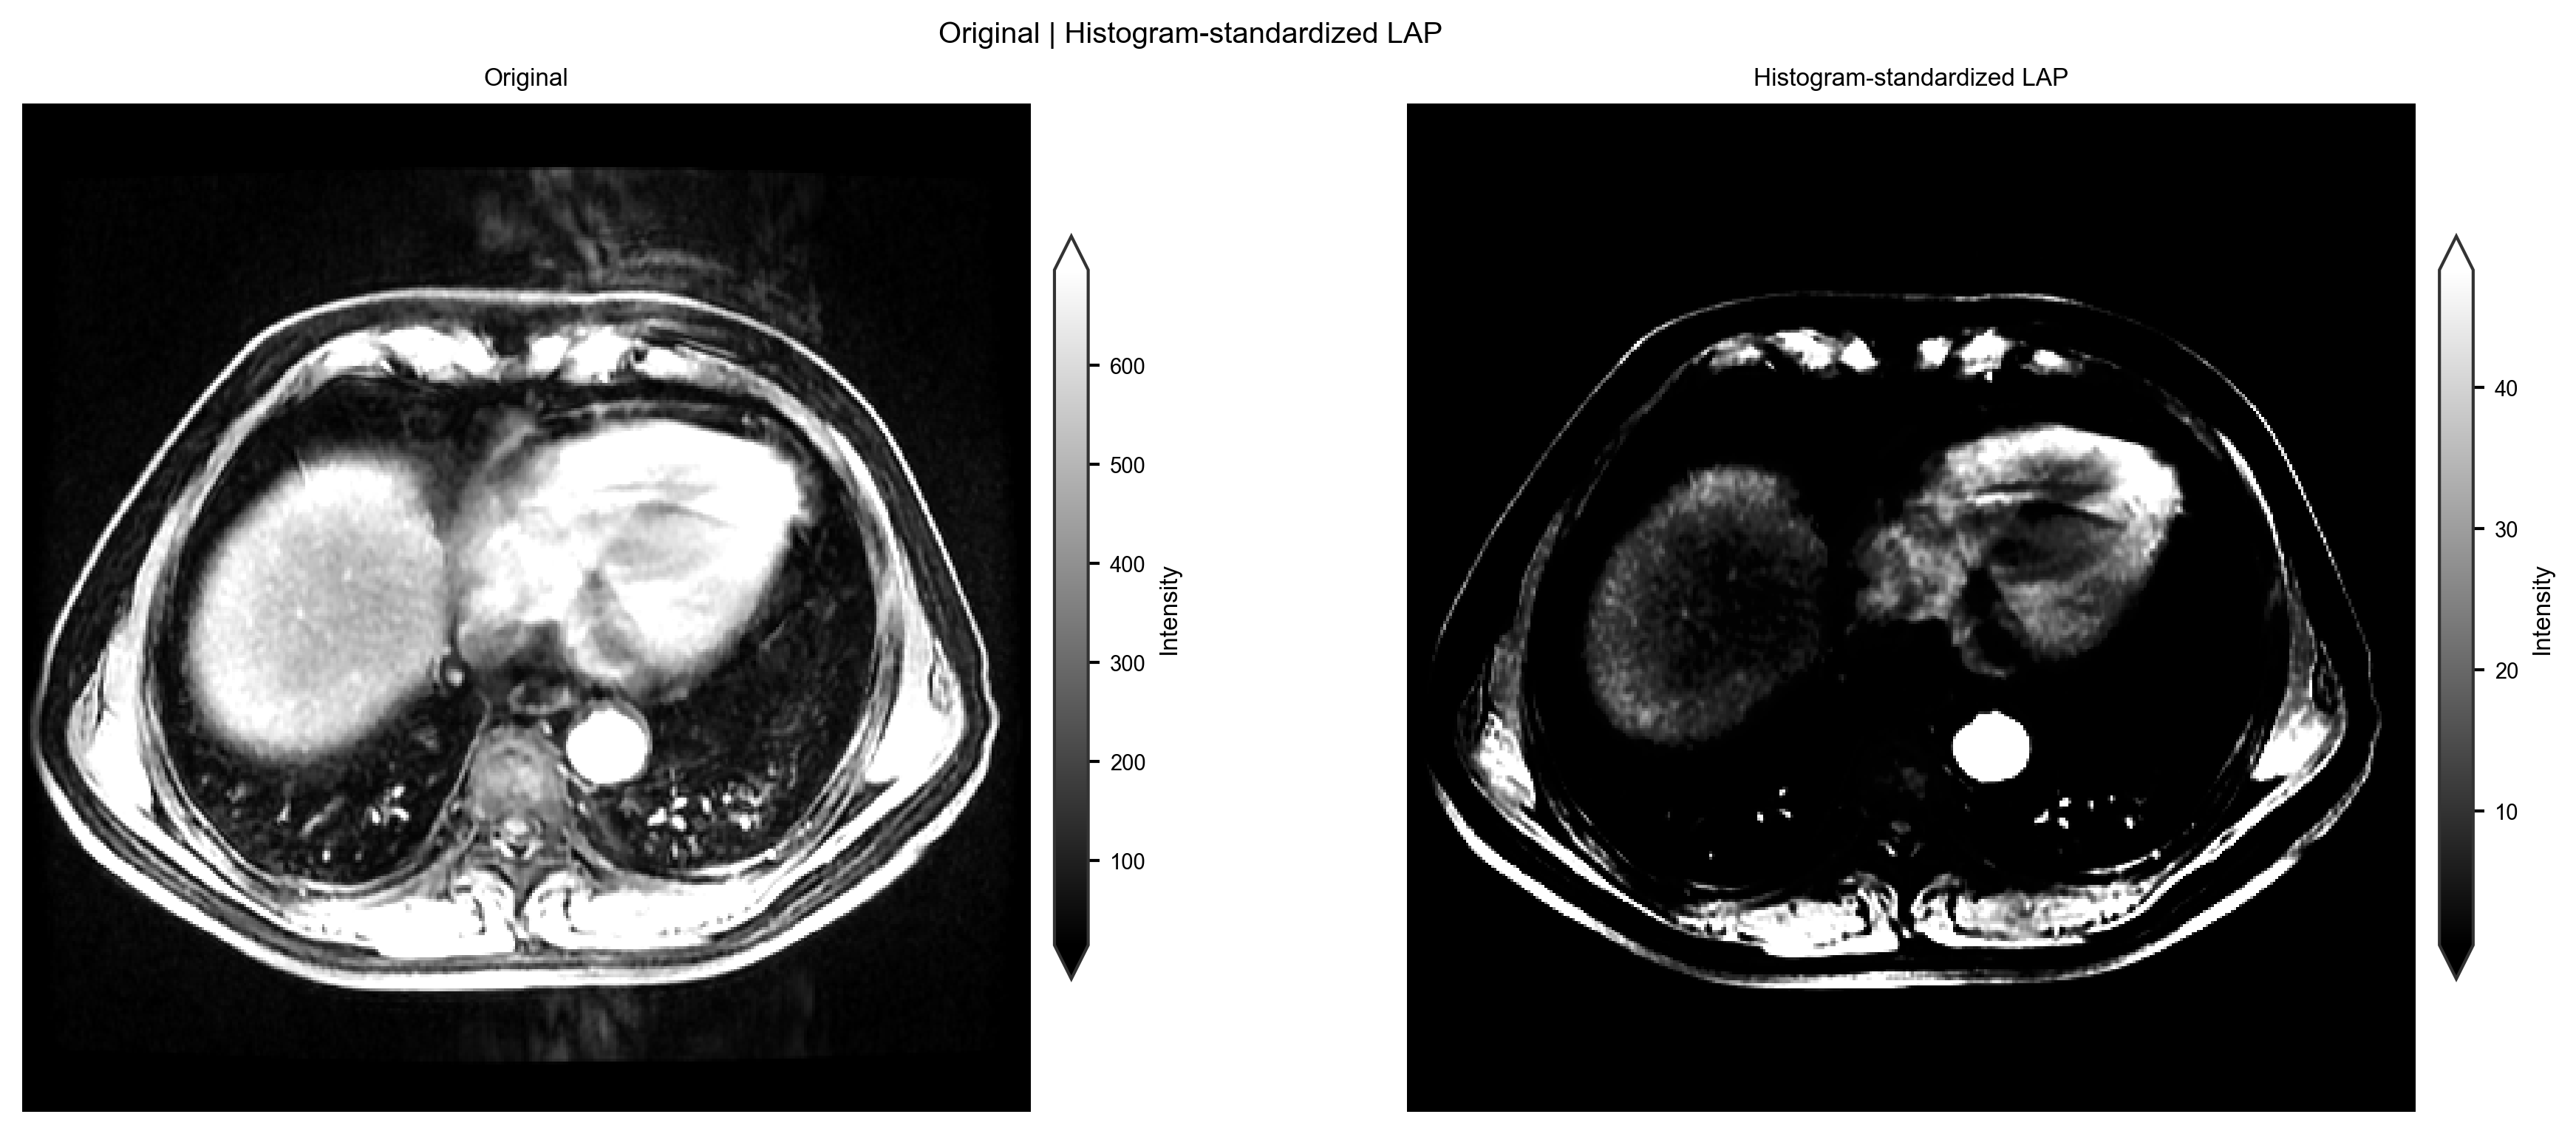
Nyúl histogram standardization. Independent colorbars show the mapped intensity range.
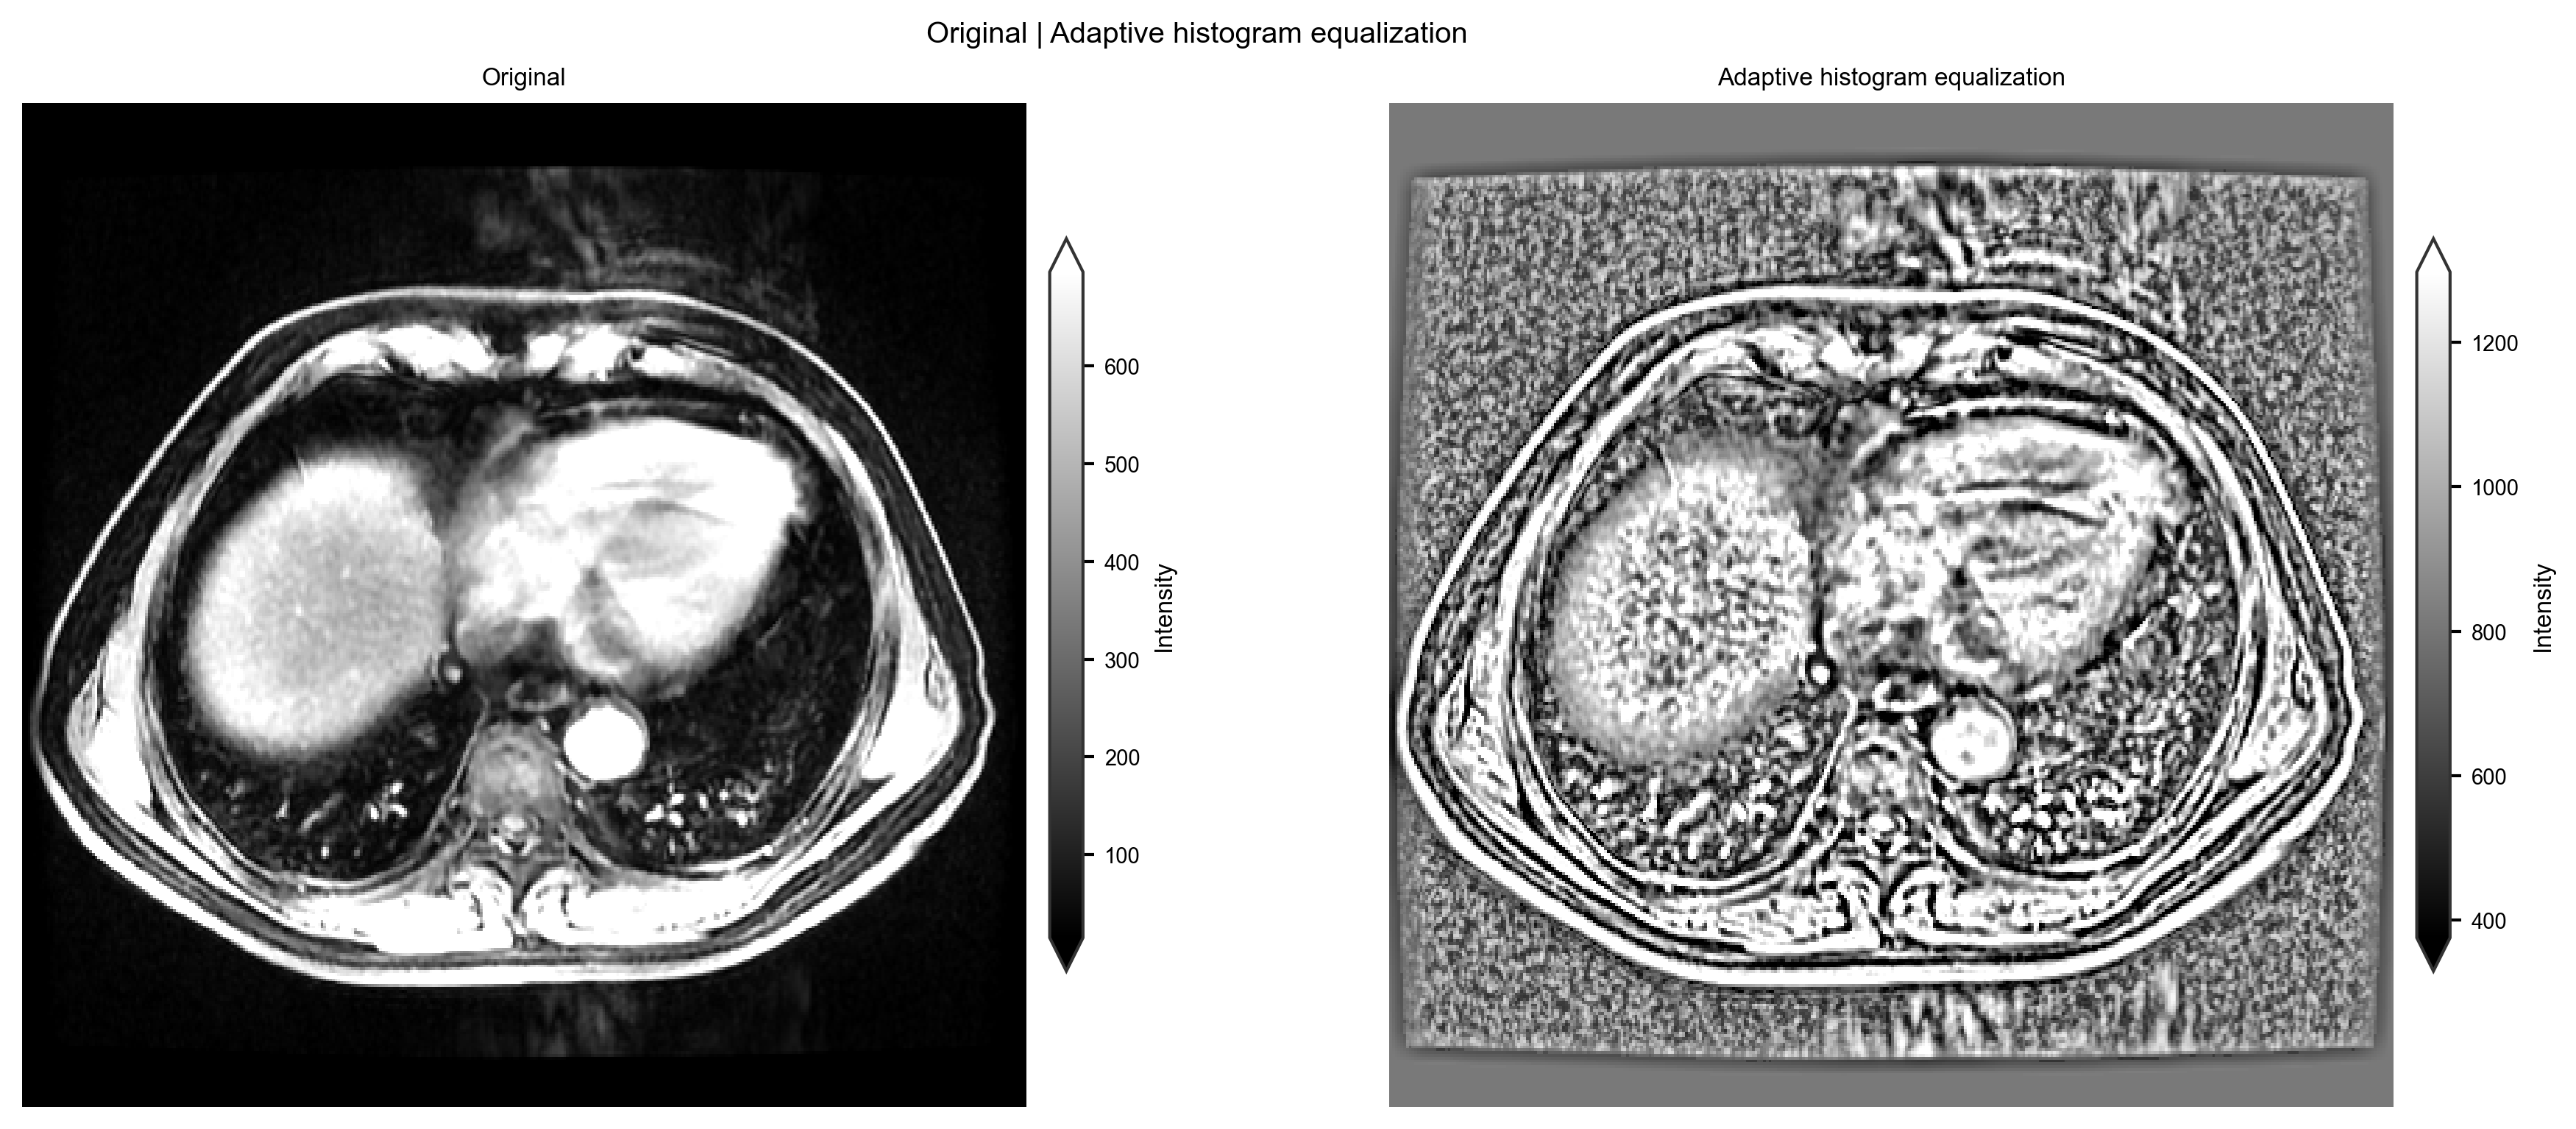
Adaptive histogram equalization. Independent colorbars show the intensity scale.
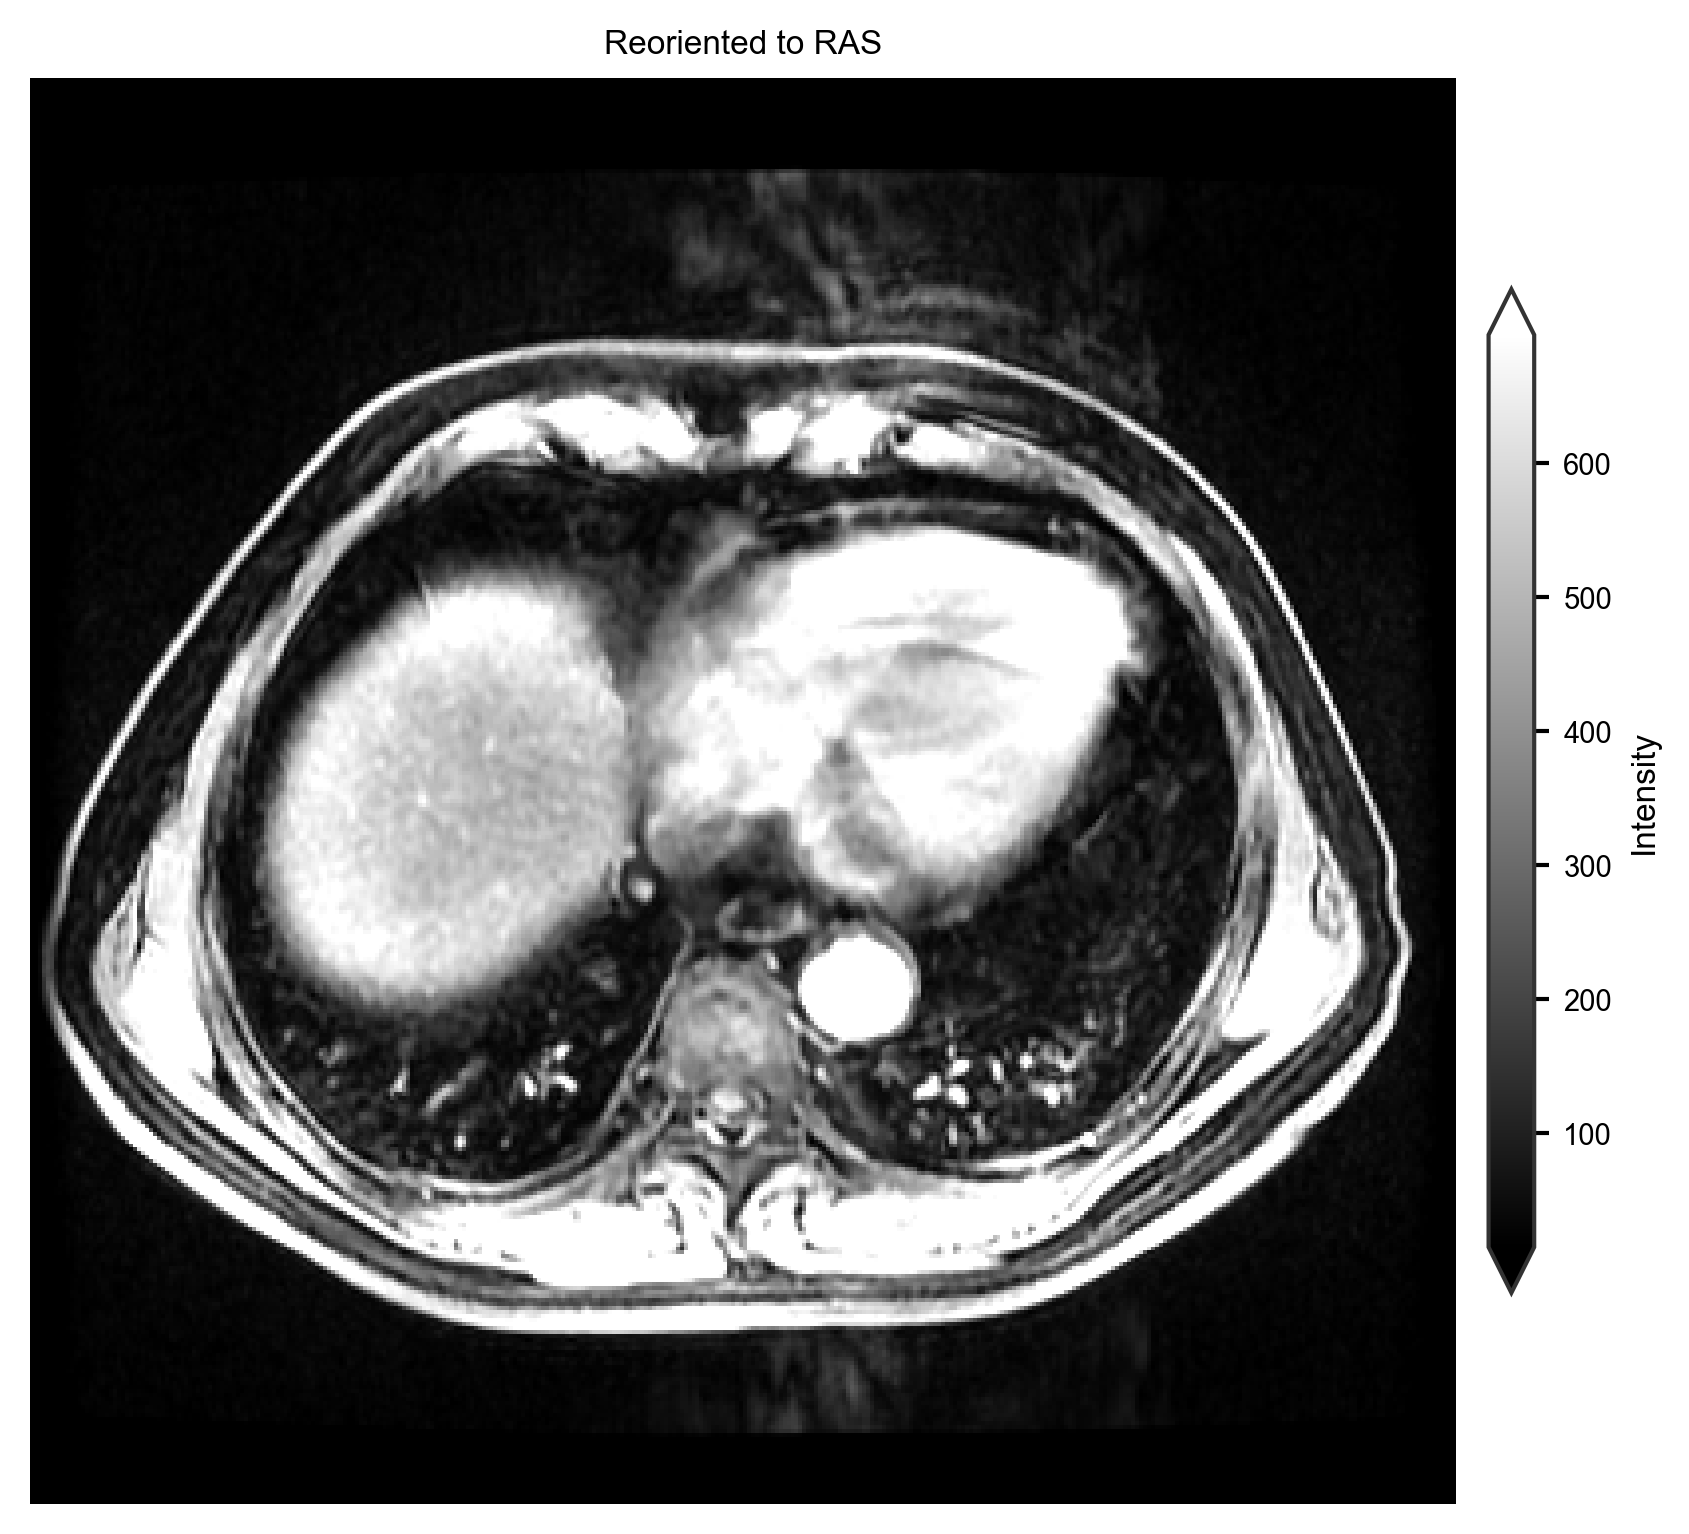
Reorient to RAS.
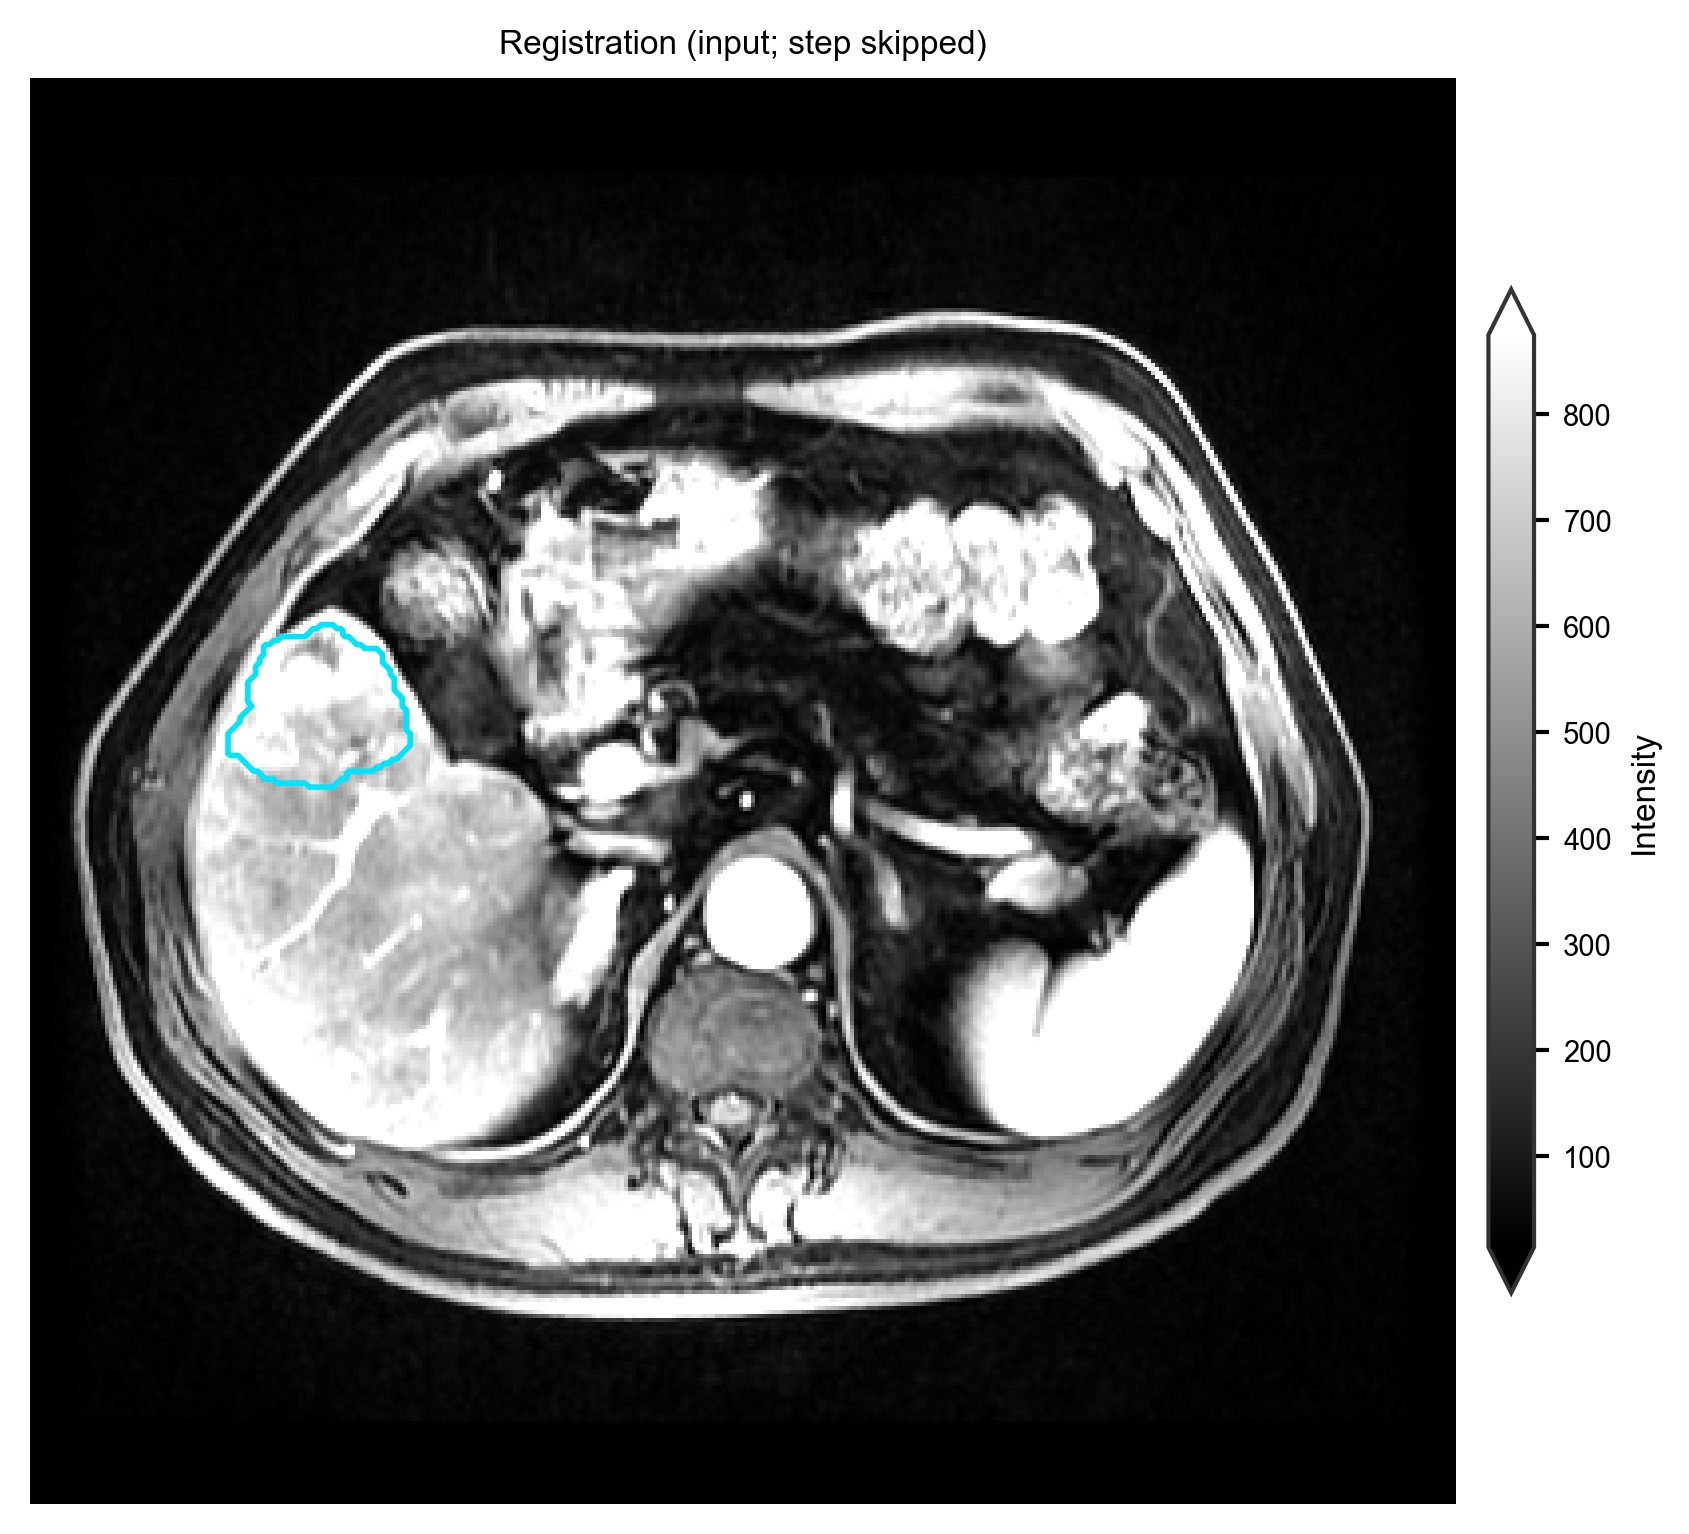
SimpleITK affine registration (ROI contour follows the transform).
dcm2nii is CLI-only (needs a DICOM tree):
habit preprocess --config config/preprocessing/config_preprocessing_dcm2nii_demo.yaml